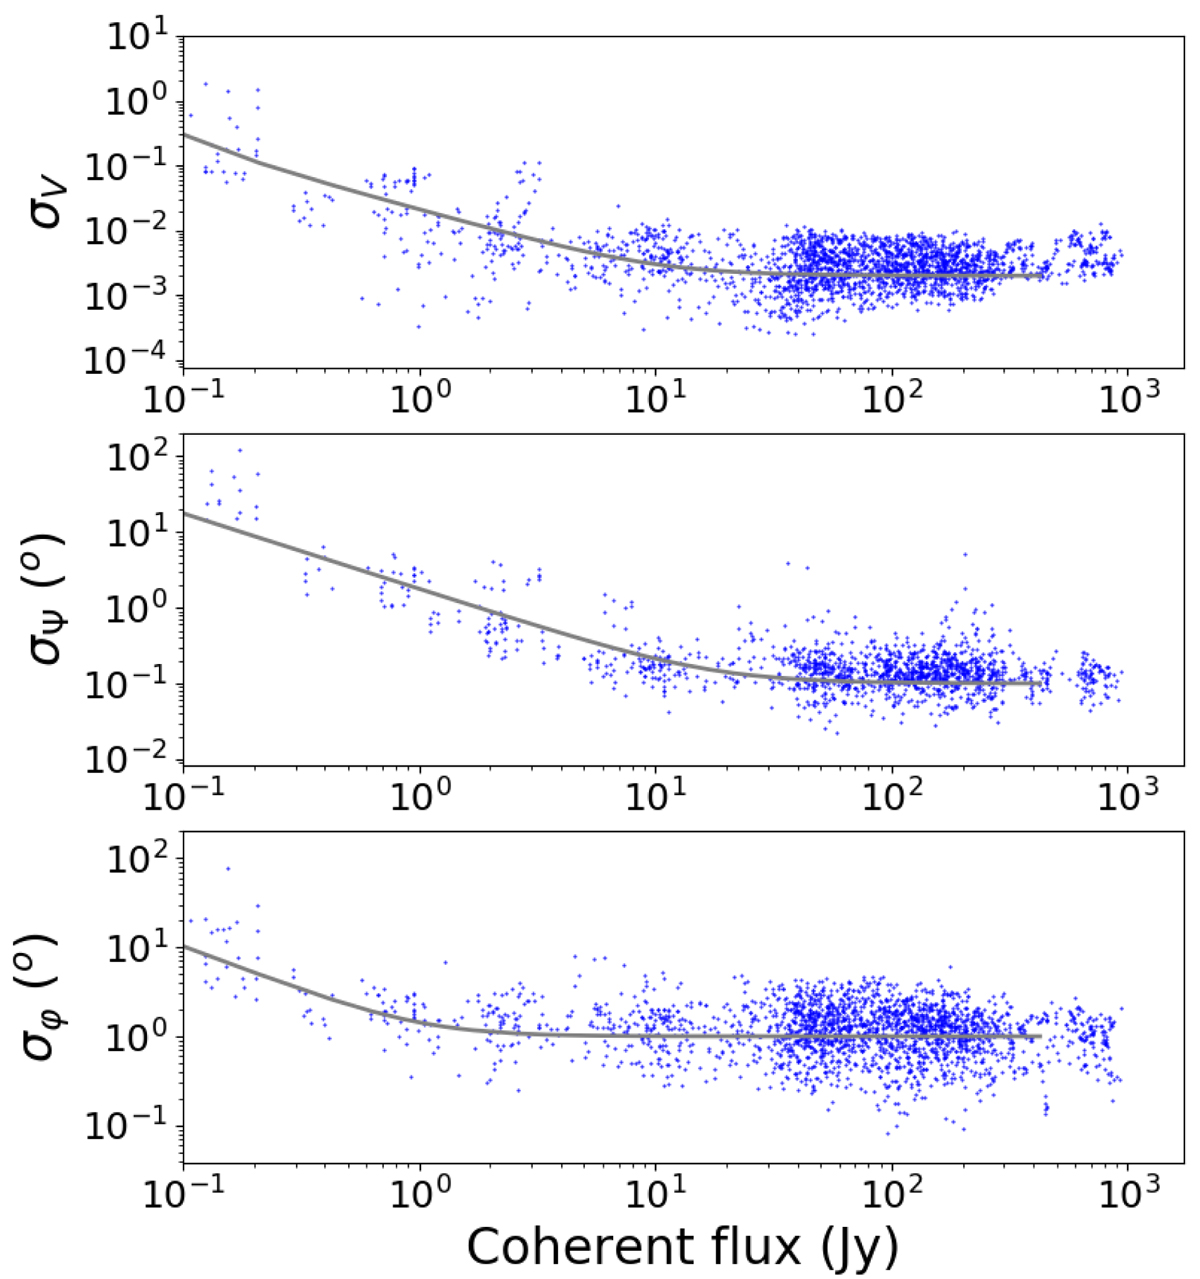
Fig. 11.
Download original image
Illustration of the fundamental noises’ contribution for L band low spectral resolution observations with the ATs. The blue dots represent the measurement precisions per spectral channel and per 1 mn exposure as a function of the source coherent flux for the absolute visibility (top), the closure phase (middle), and the differential phase (bottom). The solid grey line shows the tuned error prediction that goes through the median of the measures.
Current usage metrics show cumulative count of Article Views (full-text article views including HTML views, PDF and ePub downloads, according to the available data) and Abstracts Views on Vision4Press platform.
Data correspond to usage on the plateform after 2015. The current usage metrics is available 48-96 hours after online publication and is updated daily on week days.
Initial download of the metrics may take a while.