Fig. 9.
Download original image
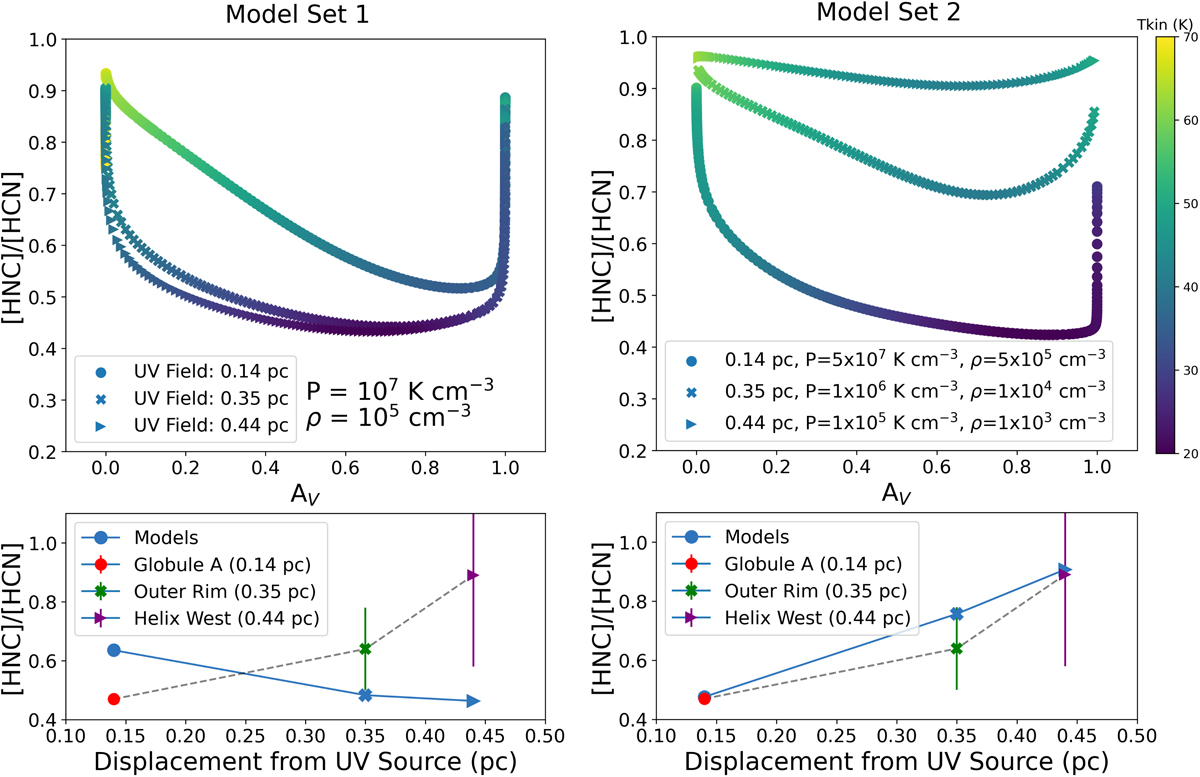
Top row: curves of the [HNC]/[HCN] abundance ratio output by the Meudon PDR modeling code are plotted against extinction, for a representative slab of gas with integrated AV = 1.0 of a representative slab of gas. Points are colored based on kinetic gas temperature, which peaks toward the edges of the slab. Bottom row: average abundance ratio for each model curve is marked with the corresponding symbol (light blue), outlining the predicted trend with respect to displacement from the UV flux source. Additional points (red, green, blue) mark the IRAM 30 m observed line ratios for the three modeled positions (Globules, Rim, Plumes), respectively. Left: Model Set 1. HNC/HCN of three model slabs with increasing distances from the UV source, thus decreasing incident UV flux. Pressure and density remain fixed. Right: model Set 2. UV flux, pressure, and density are all decreased with increasing distance from the CSPN. See Sect. 5.2.
Current usage metrics show cumulative count of Article Views (full-text article views including HTML views, PDF and ePub downloads, according to the available data) and Abstracts Views on Vision4Press platform.
Data correspond to usage on the plateform after 2015. The current usage metrics is available 48-96 hours after online publication and is updated daily on week days.
Initial download of the metrics may take a while.