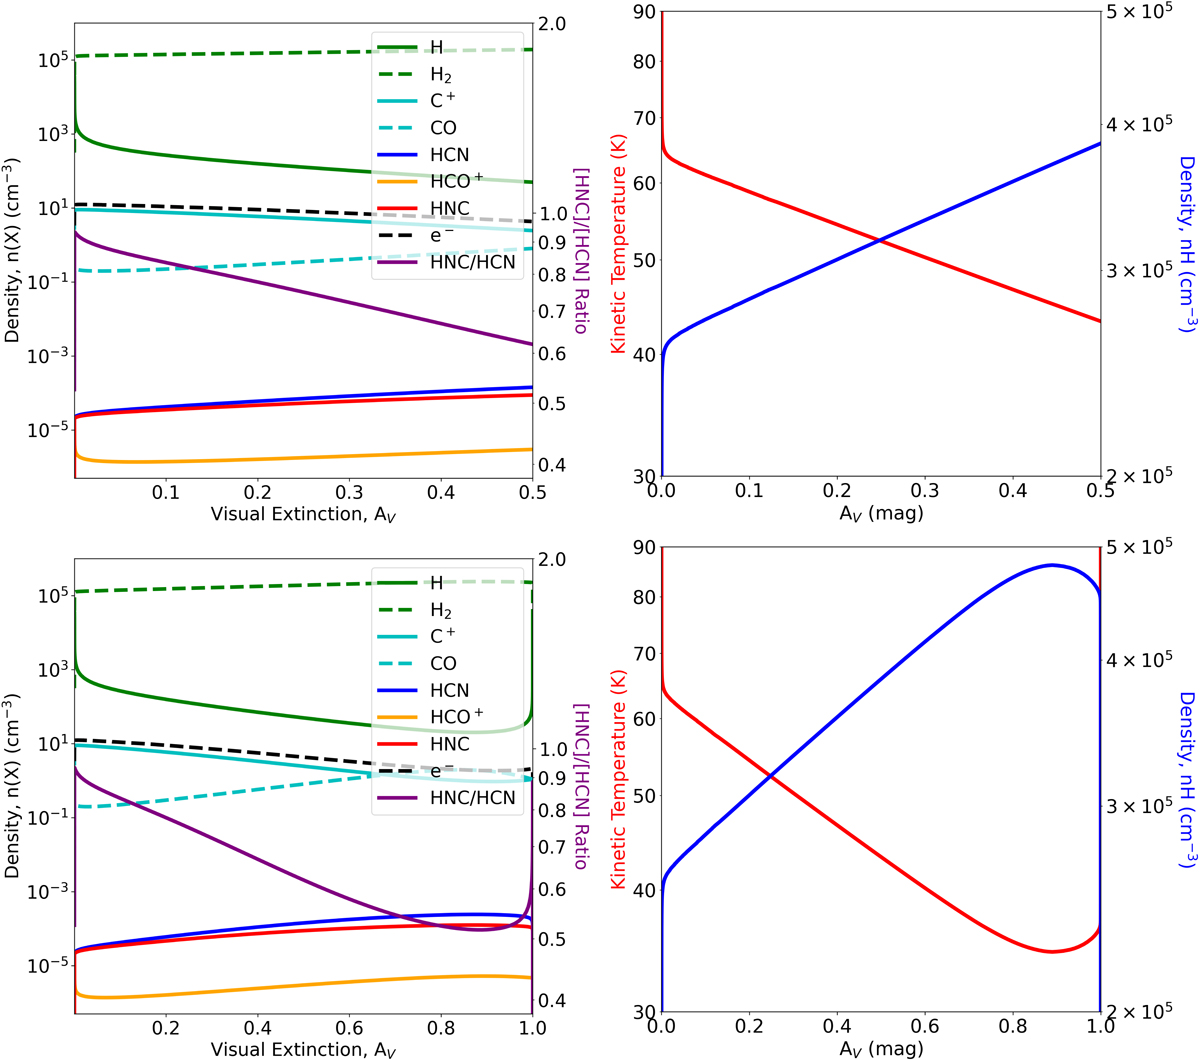
Fig. 8.
Download original image
Molecular and atomic densities and gas parameters across a gas slab of extinction AV = 0.5 (top) and AV = 1.0 (bottom), with fixed pressure P = 107 K cm−3 and density ρ = 105 cm−3, irradiated by a WD model spectrum of T = 100 000 K (Levenhagen et al. 2017). Left: density of selected species across the visual extinction of the slab. The abundance ratio of HNC/HCN is plotted as a solid purple line, with scale indicated on the right-hand y-axis. Right: temperature and density across the model slab.
Current usage metrics show cumulative count of Article Views (full-text article views including HTML views, PDF and ePub downloads, according to the available data) and Abstracts Views on Vision4Press platform.
Data correspond to usage on the plateform after 2015. The current usage metrics is available 48-96 hours after online publication and is updated daily on week days.
Initial download of the metrics may take a while.