Open Access
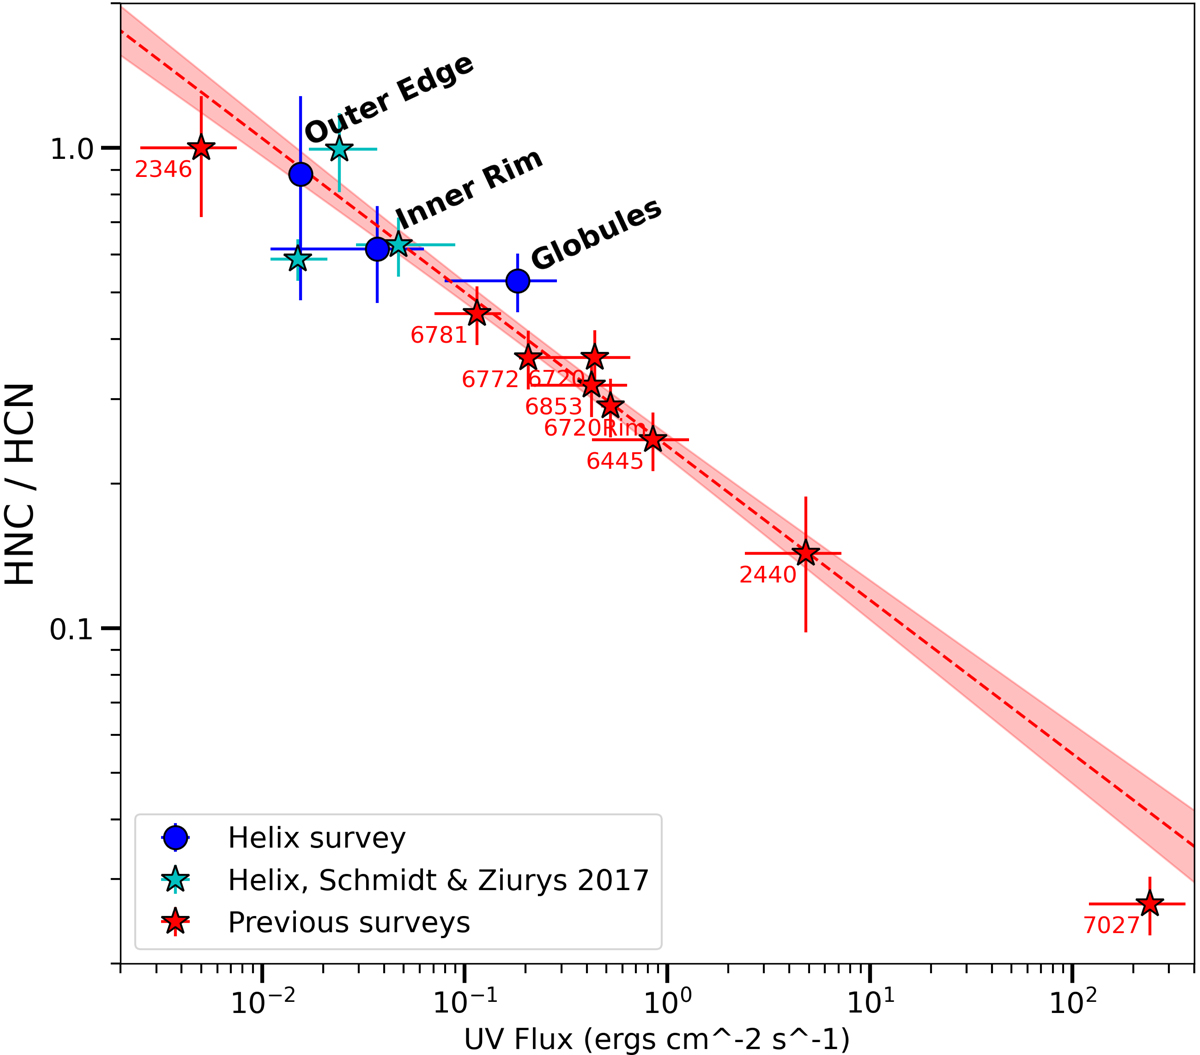
Fig. 4.
Download original image
HNC/HCN line ratio versus UV flux for the averaged representative Helix Nebula positions (blue symbols) and similar molecule-rich PNe (red symbols with associated NGC numbers). A linear regression fit to all data points is indicated as a red dashed line, with the range of 1σ uncertainty shown as red shading.
Current usage metrics show cumulative count of Article Views (full-text article views including HTML views, PDF and ePub downloads, according to the available data) and Abstracts Views on Vision4Press platform.
Data correspond to usage on the plateform after 2015. The current usage metrics is available 48-96 hours after online publication and is updated daily on week days.
Initial download of the metrics may take a while.