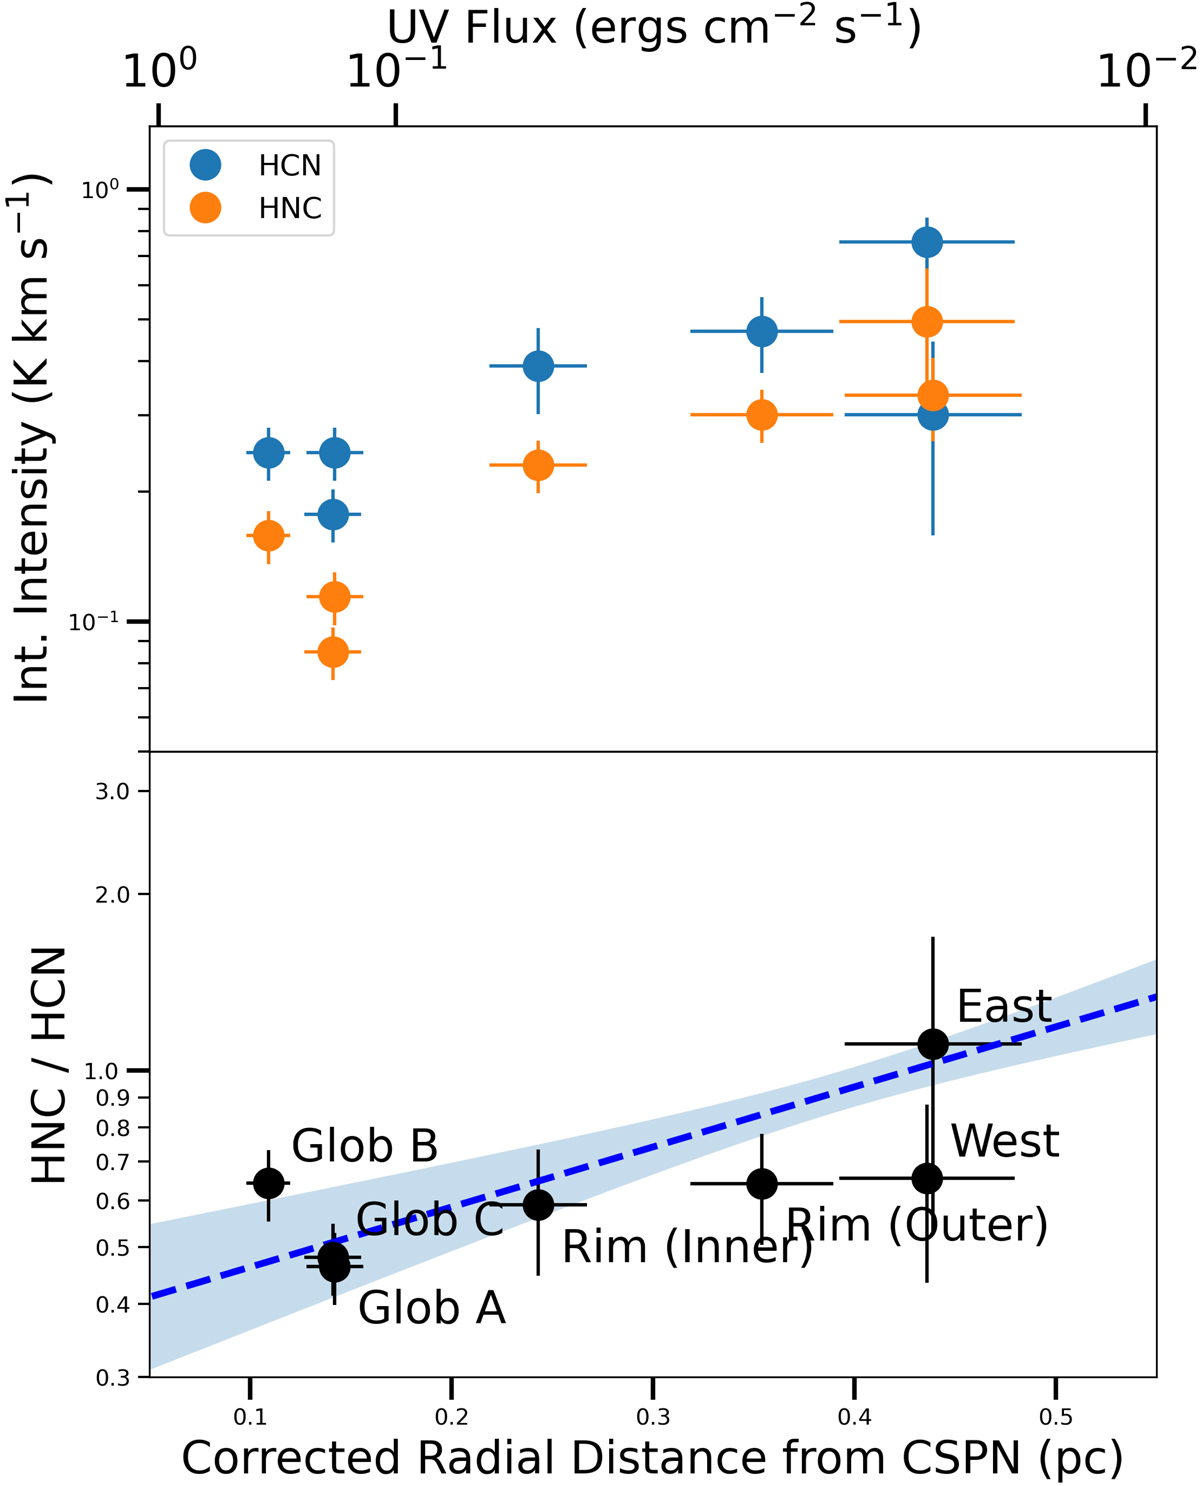
Fig. 3.
Download original image
Measurements of HCN and HNC emission versus radius and flux. Top: integrated line intensities of HCN and HNC for seven regions throughout the Helix Nebula at varying deprojected distance from the CSPN. Computed UV flux units are shown along the upper axis. Bottom: line ratio of HNC/HCN against distance. The blue dashed line indicates a linear regression fit, with the shaded region representing 1σ uncertainty.
Current usage metrics show cumulative count of Article Views (full-text article views including HTML views, PDF and ePub downloads, according to the available data) and Abstracts Views on Vision4Press platform.
Data correspond to usage on the plateform after 2015. The current usage metrics is available 48-96 hours after online publication and is updated daily on week days.
Initial download of the metrics may take a while.