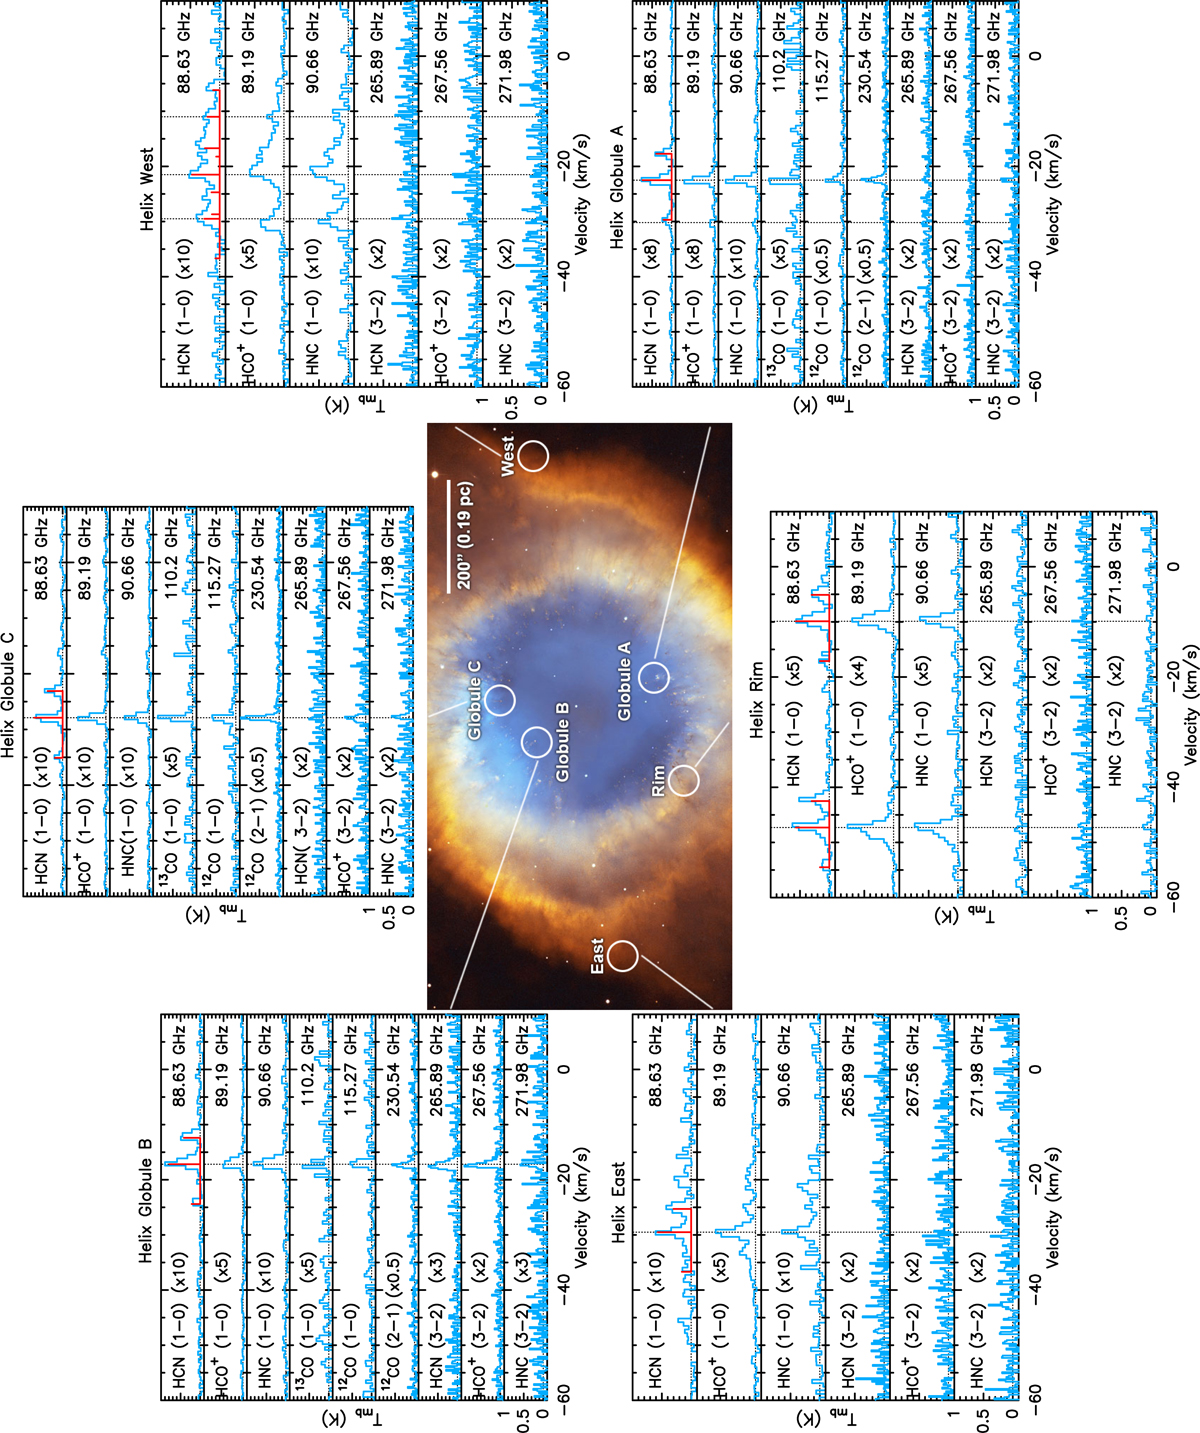
Fig. 1.
Download original image
Spectra for transitions of molecules detected in the six Helix positions using IRAM 30 m. Individual spectra have been scaled by a multiplier indicated for each line to facilitate comparison. The x-axis indicates velocity with respect to the local standard of rest (VLSR) and the y-axis is the antenna main-beam temperature (K). Vertical dotted lines mark the systemic velocity of individual emission features with respect to the entire nebula. Hyperfine structure lines are indicated in red. The two separate velocity features identified toward the Globule A, Helix Rim, and West positions represent emission from nearer and more distant clumps of gas. Positions are indicated on an HST optical image of the Helix (NASA, NOAO, ESA, the Hubble Helix Nebula Team, M. Meixner (STScI), and T.A. Rector (NRAO)), with the HCN (J = 1 → 0) beamsize (27.6″) and positions of our line survey observations as circles (globules A, B, C – from Huggins et al. 1992 – molecular Rim, East, and West positions).
Current usage metrics show cumulative count of Article Views (full-text article views including HTML views, PDF and ePub downloads, according to the available data) and Abstracts Views on Vision4Press platform.
Data correspond to usage on the plateform after 2015. The current usage metrics is available 48-96 hours after online publication and is updated daily on week days.
Initial download of the metrics may take a while.