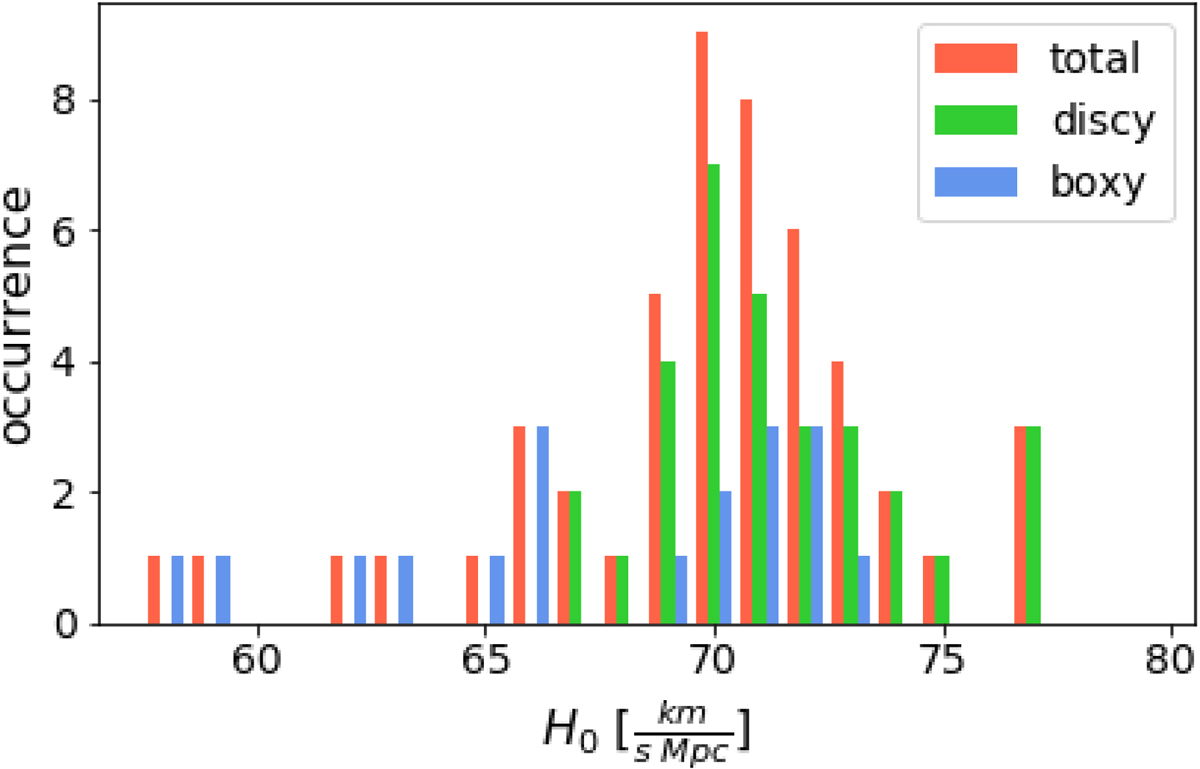
Fig. 7.
Download original image
Median H0 inference for mock systems from Table 1 with χ2 < 1.2 (see text for more information). The histogram for boxy galxies is displayed in blue, that for discy ones is in green, and the sum of both is in red. The histograms are representative of the retrieved H0 values obtained in our systematic tests that encompass multipole amplitudes of plausible lenses. However, this does not represent an inferred H0 distribution from a realistic population of lenses (see Fig. 9).
Current usage metrics show cumulative count of Article Views (full-text article views including HTML views, PDF and ePub downloads, according to the available data) and Abstracts Views on Vision4Press platform.
Data correspond to usage on the plateform after 2015. The current usage metrics is available 48-96 hours after online publication and is updated daily on week days.
Initial download of the metrics may take a while.