Fig. 9.
Download original image
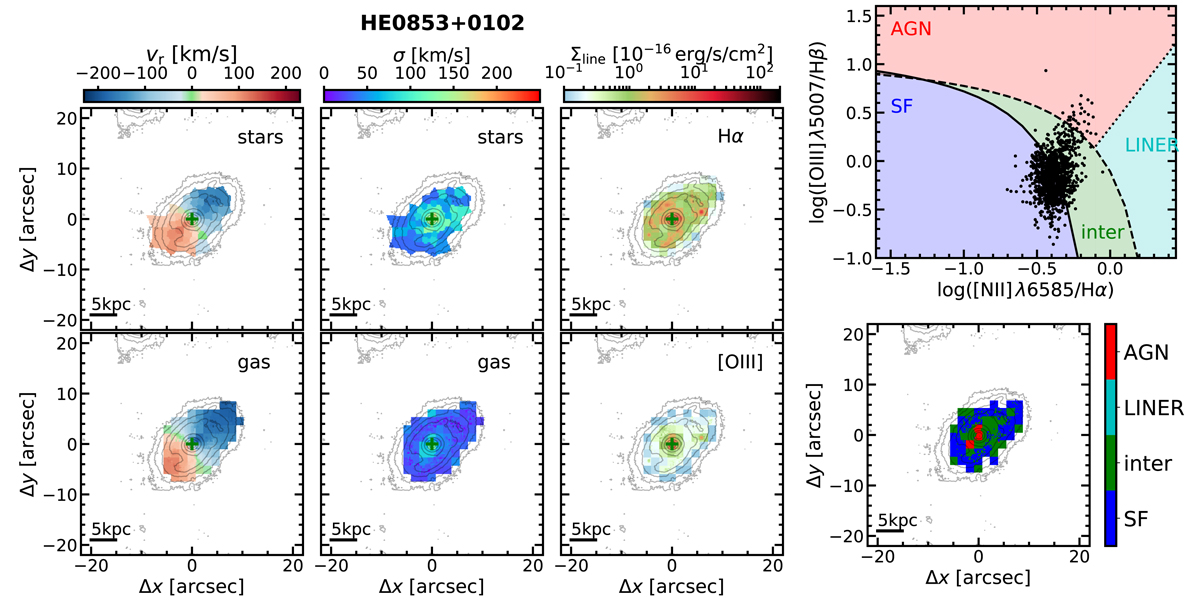
Results of the 2D continuum and emission line modeling of the AGN-subtracted data of HE 0853+0102. The radial velocity and velocity dispersion of the stars and gas are shown in the first two columns of the left panel, and the surface brightness maps of the Hα and [O III] are shown in the right column of the left panel. The classical BPT diagram for all spaxels with S/N > 3 in all lines are presented in the upper right panel with empirical demarcations curves from Kauffmann et al. (2003), Kewley et al. (2001) and Stasińska et al. (2008) overplotted as solid, dashed and dotted lines, respectively, defining classifications into star forming (SF), intermediate (inter), Low-Ionization Nuclear Emission Region (LINER) and AGN as shaded areas. The corresponding 2D maps of the classification are shown below the BPT to visualize the ionization distribution.
Current usage metrics show cumulative count of Article Views (full-text article views including HTML views, PDF and ePub downloads, according to the available data) and Abstracts Views on Vision4Press platform.
Data correspond to usage on the plateform after 2015. The current usage metrics is available 48-96 hours after online publication and is updated daily on week days.
Initial download of the metrics may take a while.