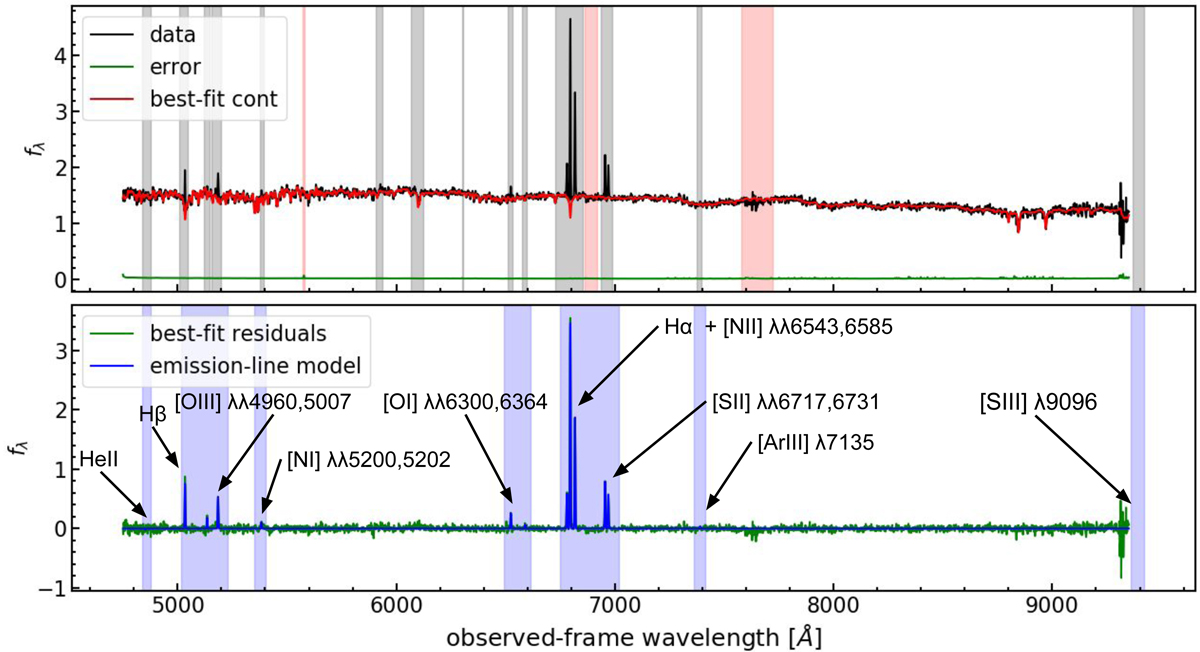
Fig. 8.
Download original image
Example of the full spectral modeling using PyParadise for one binned spectrum of HE 0433−1028. The input spectrum and error spectrum are shown in the top panels as a black and green line, respectively. Emission-line contaminated regions and prominent sky or telluric absorption features are indicated by the gray and red shaded areas. The corresponding best-fit continuum model is shown as the red line. The residual spectrum is highlighted in the lower panel with best-fit single Gaussian emission-line models represented by the blue lines. The wavelength range modeled for the emission-line detection are represented by the blue shaded areas. All fitted emission lines are annotated for reference and identification.
Current usage metrics show cumulative count of Article Views (full-text article views including HTML views, PDF and ePub downloads, according to the available data) and Abstracts Views on Vision4Press platform.
Data correspond to usage on the plateform after 2015. The current usage metrics is available 48-96 hours after online publication and is updated daily on week days.
Initial download of the metrics may take a while.