Fig. 4.
Download original image
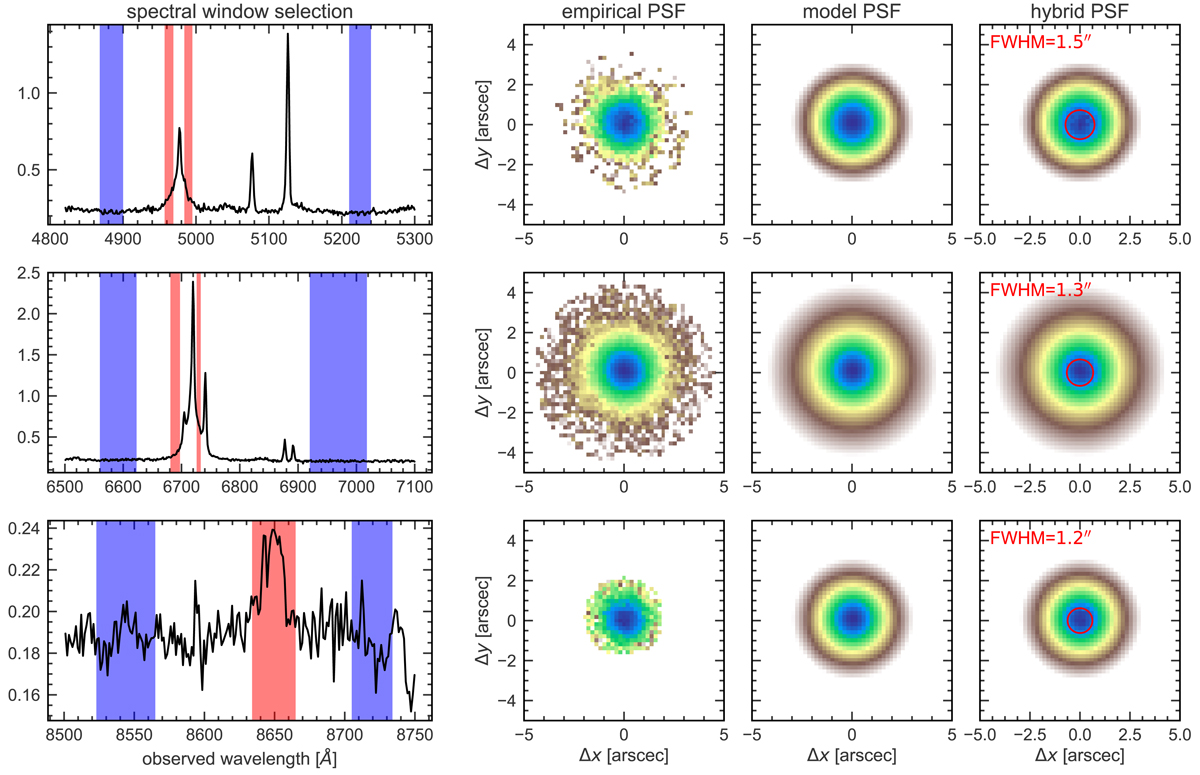
Example of PSF measurements for HE 0108−4743 based on the MUSE data. The continuum and broad line spectral wavelength regions from which the broad line intensity is mapped across the field are shown, as blue and red areas respectively, in the left panels for the spectral regions around Hβ, Hα and O Iλ8446+Ca IIλ8498 (from top to bottom). The resulting empirical PSF are shown in the 2nd column with a logarithmic intensity scaling and their best-fit 2D Moffat models are shown in the 3rd column. The hybrid PSF in the right column are created by replacing the empirical PSFs with the modeled PSFs after a certain radius which depends on the S/N of the empirical PSFs. The FWHM of PSF is indicated as the red circle on the hybrid PSFs.
Current usage metrics show cumulative count of Article Views (full-text article views including HTML views, PDF and ePub downloads, according to the available data) and Abstracts Views on Vision4Press platform.
Data correspond to usage on the plateform after 2015. The current usage metrics is available 48-96 hours after online publication and is updated daily on week days.
Initial download of the metrics may take a while.