Fig. 15.
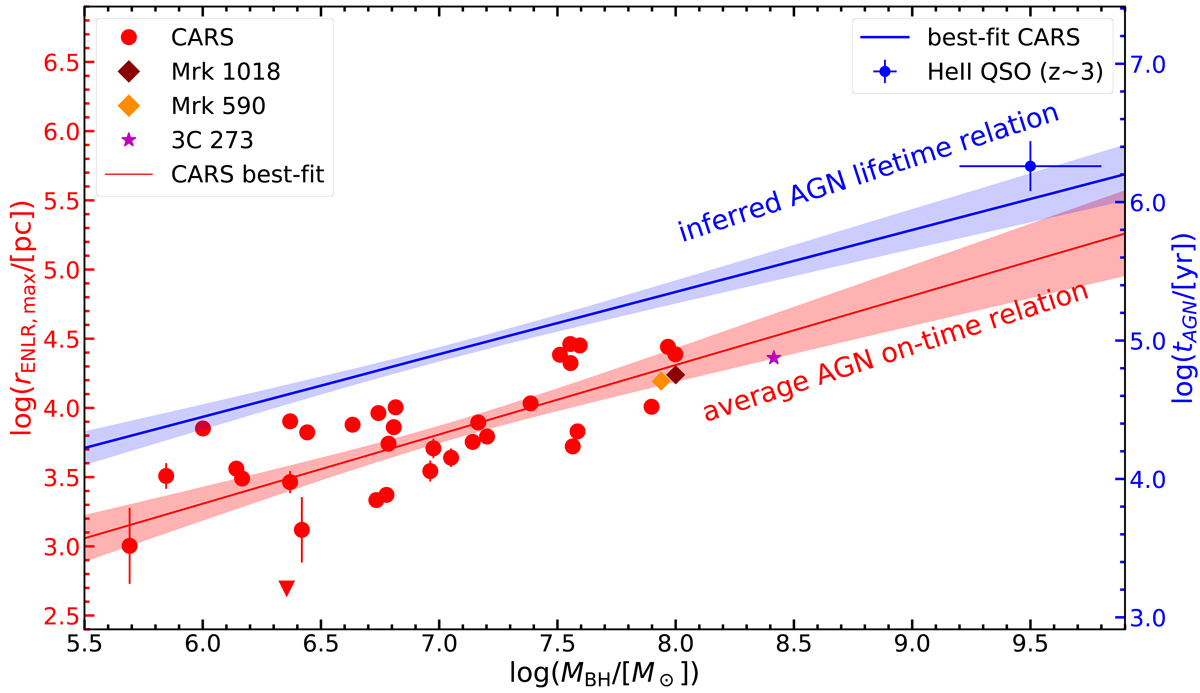
Download original image
Maximum ENLR size RENLR, max as a function of BH mass MBH for the CARS sample. A linear best-fit relation to the CARS data is shown as the red line with corresponding confidence area highlight as shaded area. The changing-look AGN Mrk 590 and Mrk 1018 are denoted by the colored diamond symbols and the local hyper-luminous QSOs 3C 273 from Husemann et al. (2019a) as a star symbol. The right axis shows the AGN life time tAGN in blue colors. Taking into account the effect of inclination and random sampling of AGN during their life time, our inferred AGN life time relation from MCMC sampling is shown as the blue line. An independent measurement of the AGN life time based on the He II proximity zones around z ∼ 3 QSOs from Khrykin et al. (2021) is shown as a blue point with uncertainties.
Current usage metrics show cumulative count of Article Views (full-text article views including HTML views, PDF and ePub downloads, according to the available data) and Abstracts Views on Vision4Press platform.
Data correspond to usage on the plateform after 2015. The current usage metrics is available 48-96 hours after online publication and is updated daily on week days.
Initial download of the metrics may take a while.