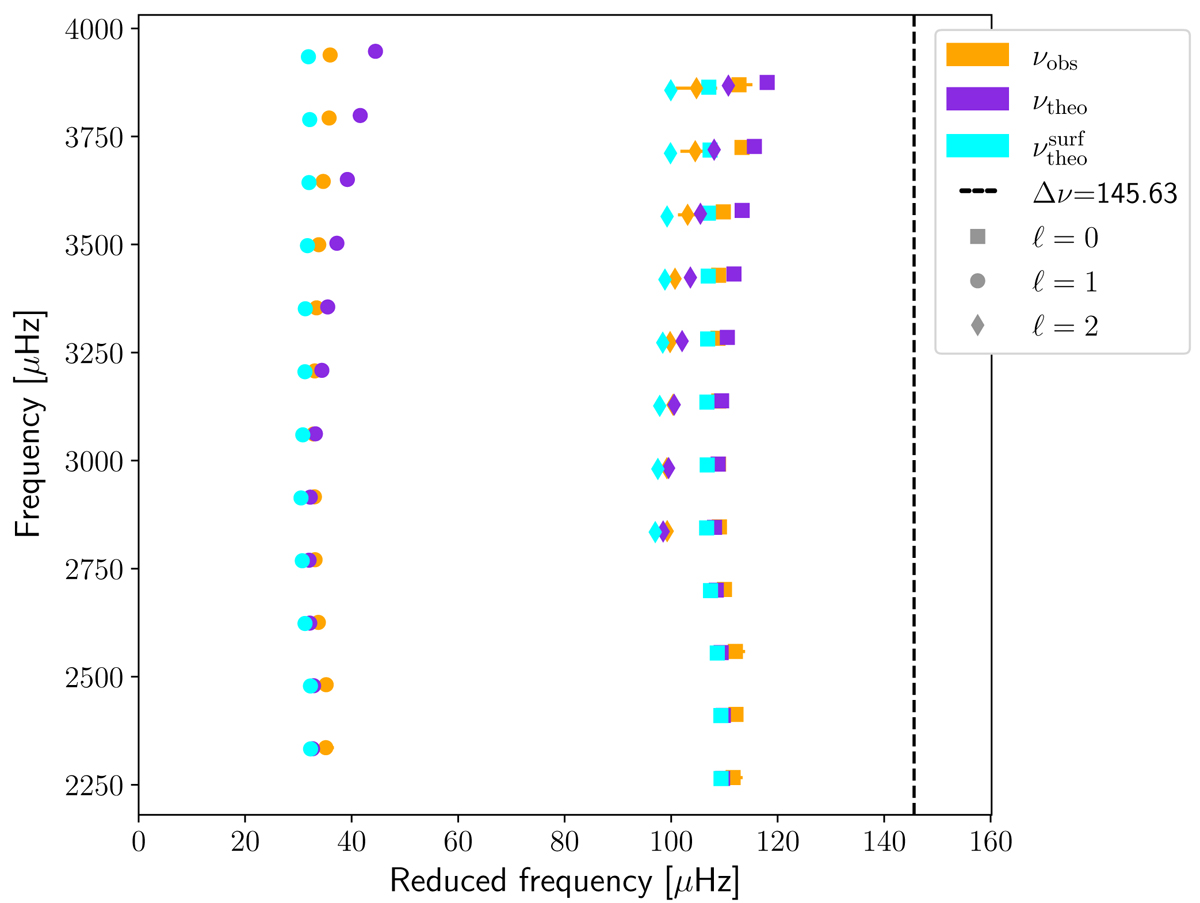
Fig. 8.
Download original image
Echelle diagram of the result of AIMS with the fit of the ratios. The inverted mean density was part of the constraints. The comparison between the results with (cyan) and without (purple) correction for the surface effect is shown. The Ball & Gizon (2014) correction was chosen for this plot, but the effect is similar with another prescription for the surface effects.
Current usage metrics show cumulative count of Article Views (full-text article views including HTML views, PDF and ePub downloads, according to the available data) and Abstracts Views on Vision4Press platform.
Data correspond to usage on the plateform after 2015. The current usage metrics is available 48-96 hours after online publication and is updated daily on week days.
Initial download of the metrics may take a while.