Fig. 2.
Download original image
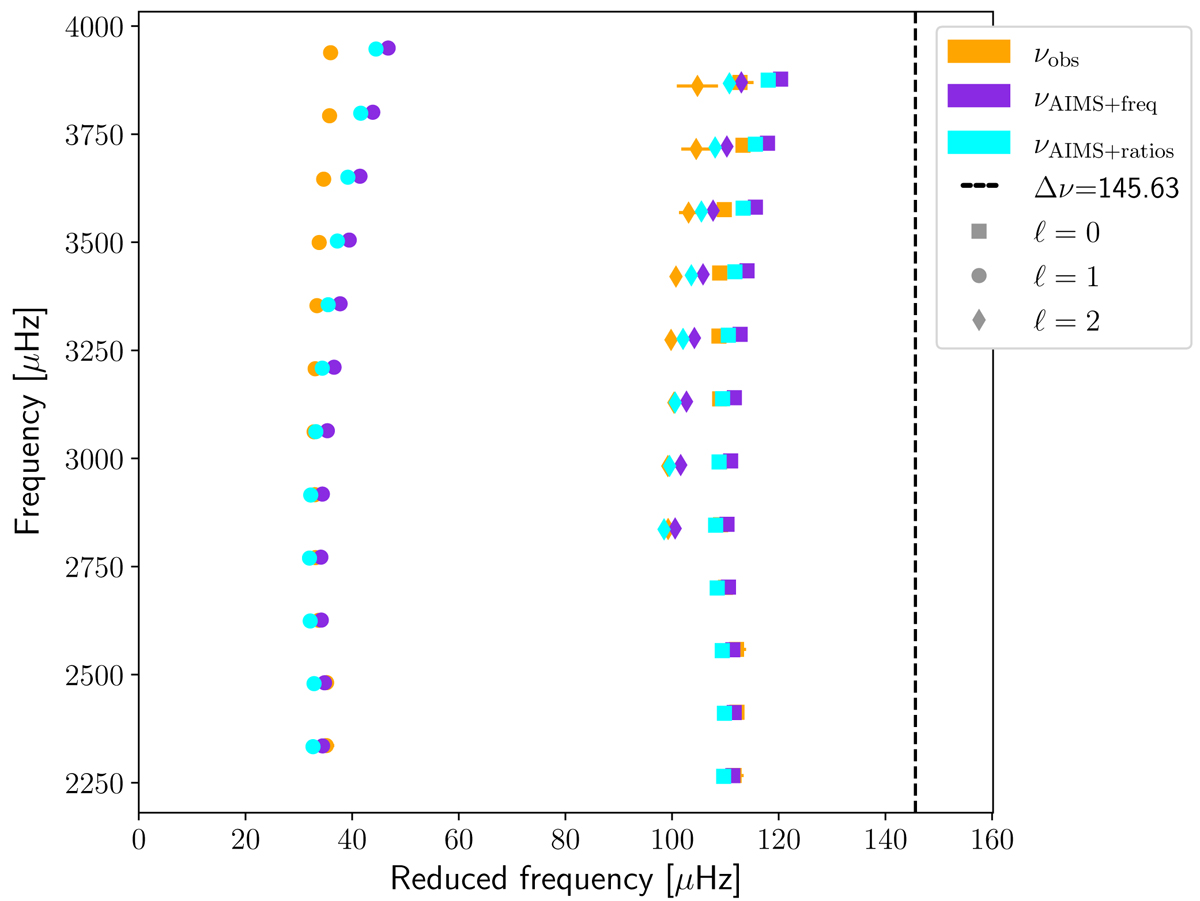
Echelle diagram of the AIMS results for the fit of the individual frequencies (purple) and of the frequency ratios r01 and r02 (cyan). The modelled frequencies are displayed without a correction for the surface effects. The large separation (dashed black line) is computed with the observed frequencies (orange) and with the definition of Reese et al. (2012). The squares are radial modes, the circles are dipole modes, and the diamonds are quadrupole modes.
Current usage metrics show cumulative count of Article Views (full-text article views including HTML views, PDF and ePub downloads, according to the available data) and Abstracts Views on Vision4Press platform.
Data correspond to usage on the plateform after 2015. The current usage metrics is available 48-96 hours after online publication and is updated daily on week days.
Initial download of the metrics may take a while.