Fig. 1.
Download original image
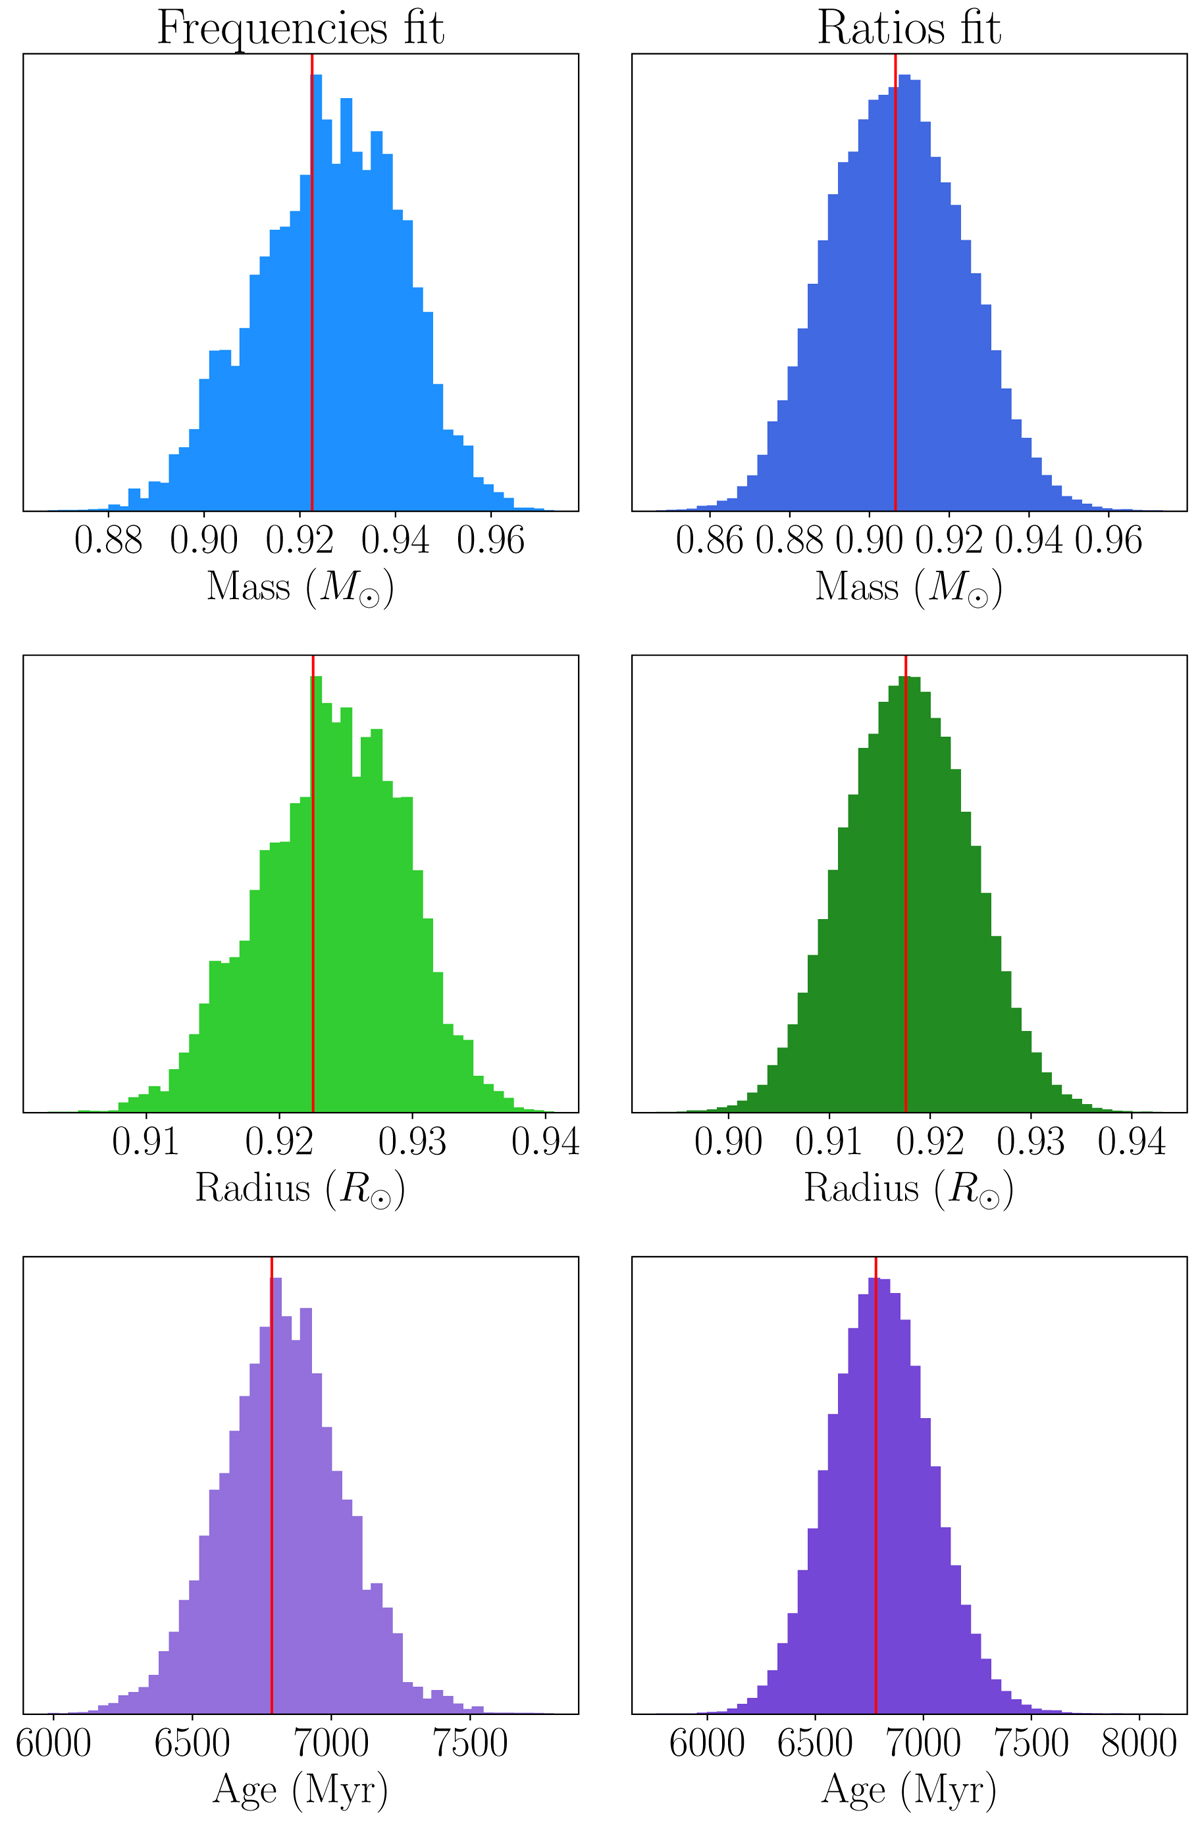
Comparison of the histograms between the fit of the individual frequencies (left column) and of the frequency ratios r01 and r02 (right column). Upper panel: histogram for the stellar mass. Middle panel: histogram for the stellar radius. Lower panel: histogram for the stellar age. The vertical red lines indicate the optimal estimates predicted by the MCMC.
Current usage metrics show cumulative count of Article Views (full-text article views including HTML views, PDF and ePub downloads, according to the available data) and Abstracts Views on Vision4Press platform.
Data correspond to usage on the plateform after 2015. The current usage metrics is available 48-96 hours after online publication and is updated daily on week days.
Initial download of the metrics may take a while.