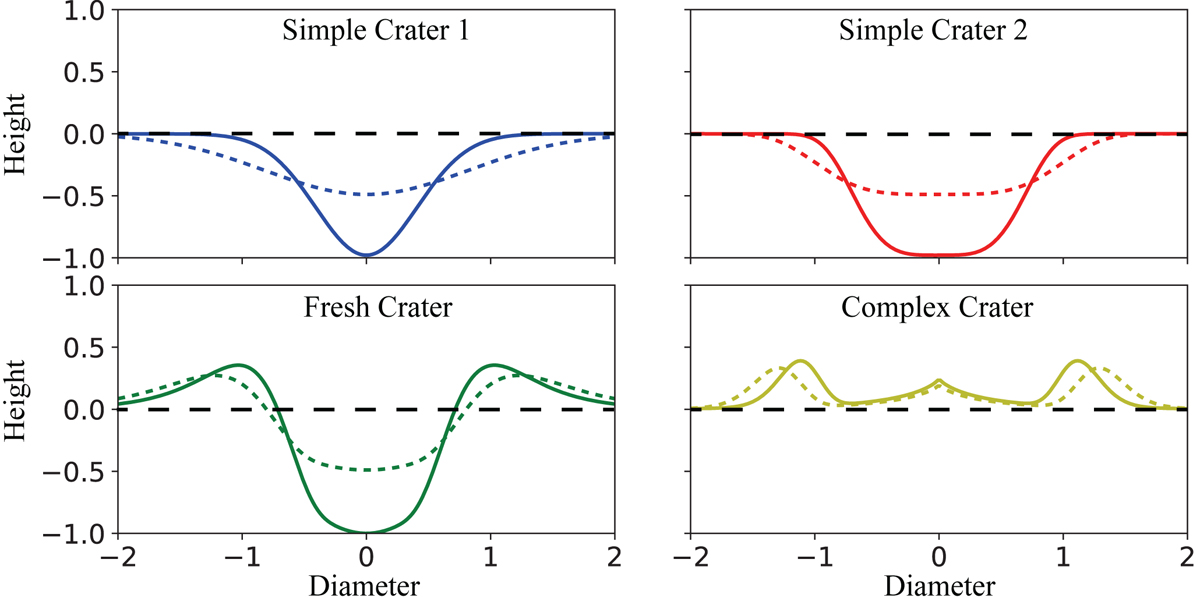
Fig. 8.
Download original image
Profile lines showing crater degradation. We can model the degradation status of craters by changing the parameters in our kernel functions. In simple craters 1 & 2, the solid line represents the original crater, while the dashed line represents the same crater but with a lower (degraded) depth-to-diameter ratio (ratio of solid/dashed line = 0.4/0.1). In fresh craters, we set the degradation vector α = (Δk = −0.3, Δγ = −0.4, Δa = −0.25) (defined in Sect. 3.3). For complex craters, we set the degradation vector α = (Δk = −0.05, Δγ = −0.2, Δa = −0.1).
Current usage metrics show cumulative count of Article Views (full-text article views including HTML views, PDF and ePub downloads, according to the available data) and Abstracts Views on Vision4Press platform.
Data correspond to usage on the plateform after 2015. The current usage metrics is available 48-96 hours after online publication and is updated daily on week days.
Initial download of the metrics may take a while.