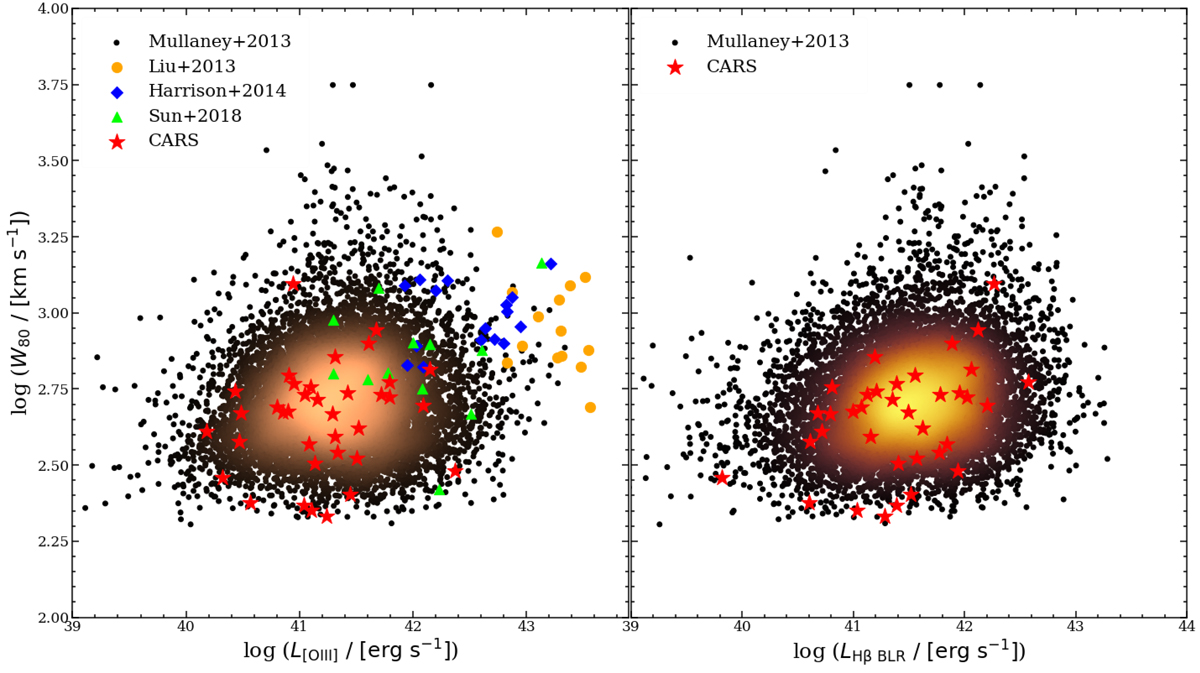
Fig. 2.
Download original image
[O III] line width described by W80 against AGN bolometric [O III] luminosity (left panel) and BLR Hβ luminosity (right panel). The yellow circles denote the type 2 AGN sample from Liu et al. (2013a), the blue diamonds denote the type 2 AGN sample by Harrison et al. (2014), the lime triangles denote the type 2 AGN sample by Sun et al. (2017) and the red stars denote our CARS sample of type 1 AGN. The dense scatter plot corresponds to the overall SDSS sample of both type 1 and type 2 (left panel) and type 1 AGN (right panel) from the ALPAKA library published by Mullaney et al. (2013).
Current usage metrics show cumulative count of Article Views (full-text article views including HTML views, PDF and ePub downloads, according to the available data) and Abstracts Views on Vision4Press platform.
Data correspond to usage on the plateform after 2015. The current usage metrics is available 48-96 hours after online publication and is updated daily on week days.
Initial download of the metrics may take a while.