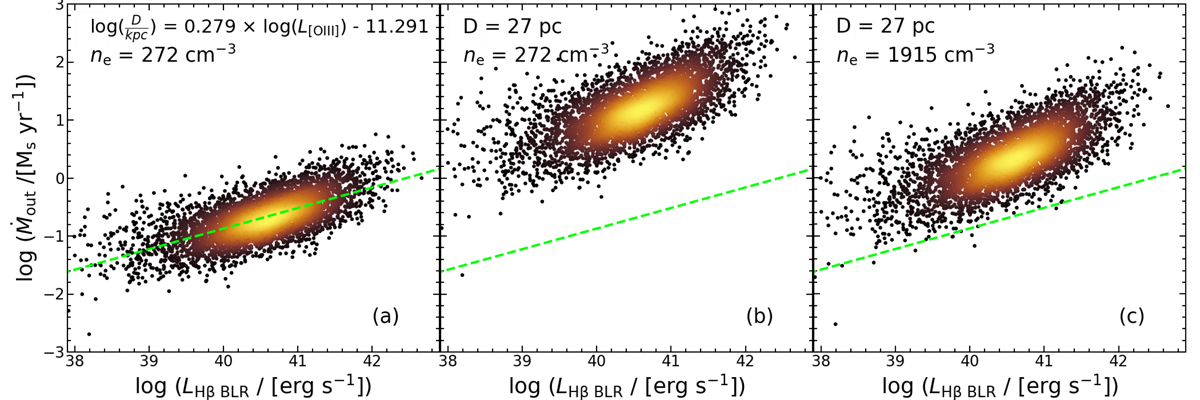
Fig. 13.
Download original image
BLR Hβ luminosity against the mass outflow rates for the type 1 AGN from Mullaney et al. (2013). Left panel: we use the outflow size vs. [O III] luminosity relation from the work of Kang & Woo (2018) to calculate the outflow radius (D). We also use the median electron density ne = 272 cm−3 as reported by Rakshit & Woo (2018). The green dashed line indicates the linear regression line of the mass outflow rates and the BLR Hβ luminosity. Mid panel: we assume that all of the outflows in this sample of type 1 AGN of Mullaney et al. (2013) to have point like [O III] wing emission; in which case the median offset between the AGN nucleus and the [O III] wing Moffat center is ∼27 pc. Therefore, we use 27 pc as the outflow radius in this case. We keep the electron density fixed to ne = 272 cm−3 as reported by Rakshit & Woo (2018). Right panel: we use ne = 1915 cm−3 which is the median electron density for the AGN with compact [O III] wing emission. We use an outflow radius of 27 pc which is about the median offset between the Moffat center of the [O III] wing and the nucleus. We over-plot the linear regression line of the mass outflow rates and the BLR Hβ luminosity in all panels to showcase the difference in mass outflow rates in the approach used in all the panels.
Current usage metrics show cumulative count of Article Views (full-text article views including HTML views, PDF and ePub downloads, according to the available data) and Abstracts Views on Vision4Press platform.
Data correspond to usage on the plateform after 2015. The current usage metrics is available 48-96 hours after online publication and is updated daily on week days.
Initial download of the metrics may take a while.