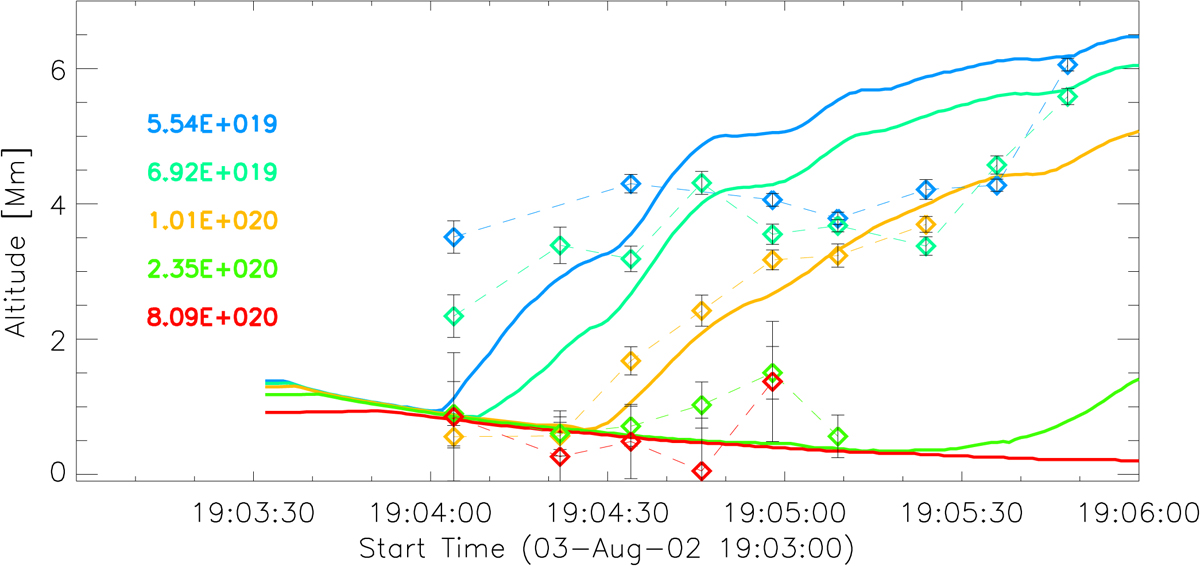
Fig. 9.
Download original image
Solid lines: column density evolution as derived from model calculations. The lines are presented for several values (cm−2) listed in the legend. Additionally we plotted locations of HXR sources (diamonds and dashed lines). The colour-coding relates energies with relevant column densities. Colours are the same as in Fig. 6, the red line is for 55 − 75 keV, yellow presents 21 − 25 keV, etc.
Current usage metrics show cumulative count of Article Views (full-text article views including HTML views, PDF and ePub downloads, according to the available data) and Abstracts Views on Vision4Press platform.
Data correspond to usage on the plateform after 2015. The current usage metrics is available 48-96 hours after online publication and is updated daily on week days.
Initial download of the metrics may take a while.