Fig. 2.
Download original image
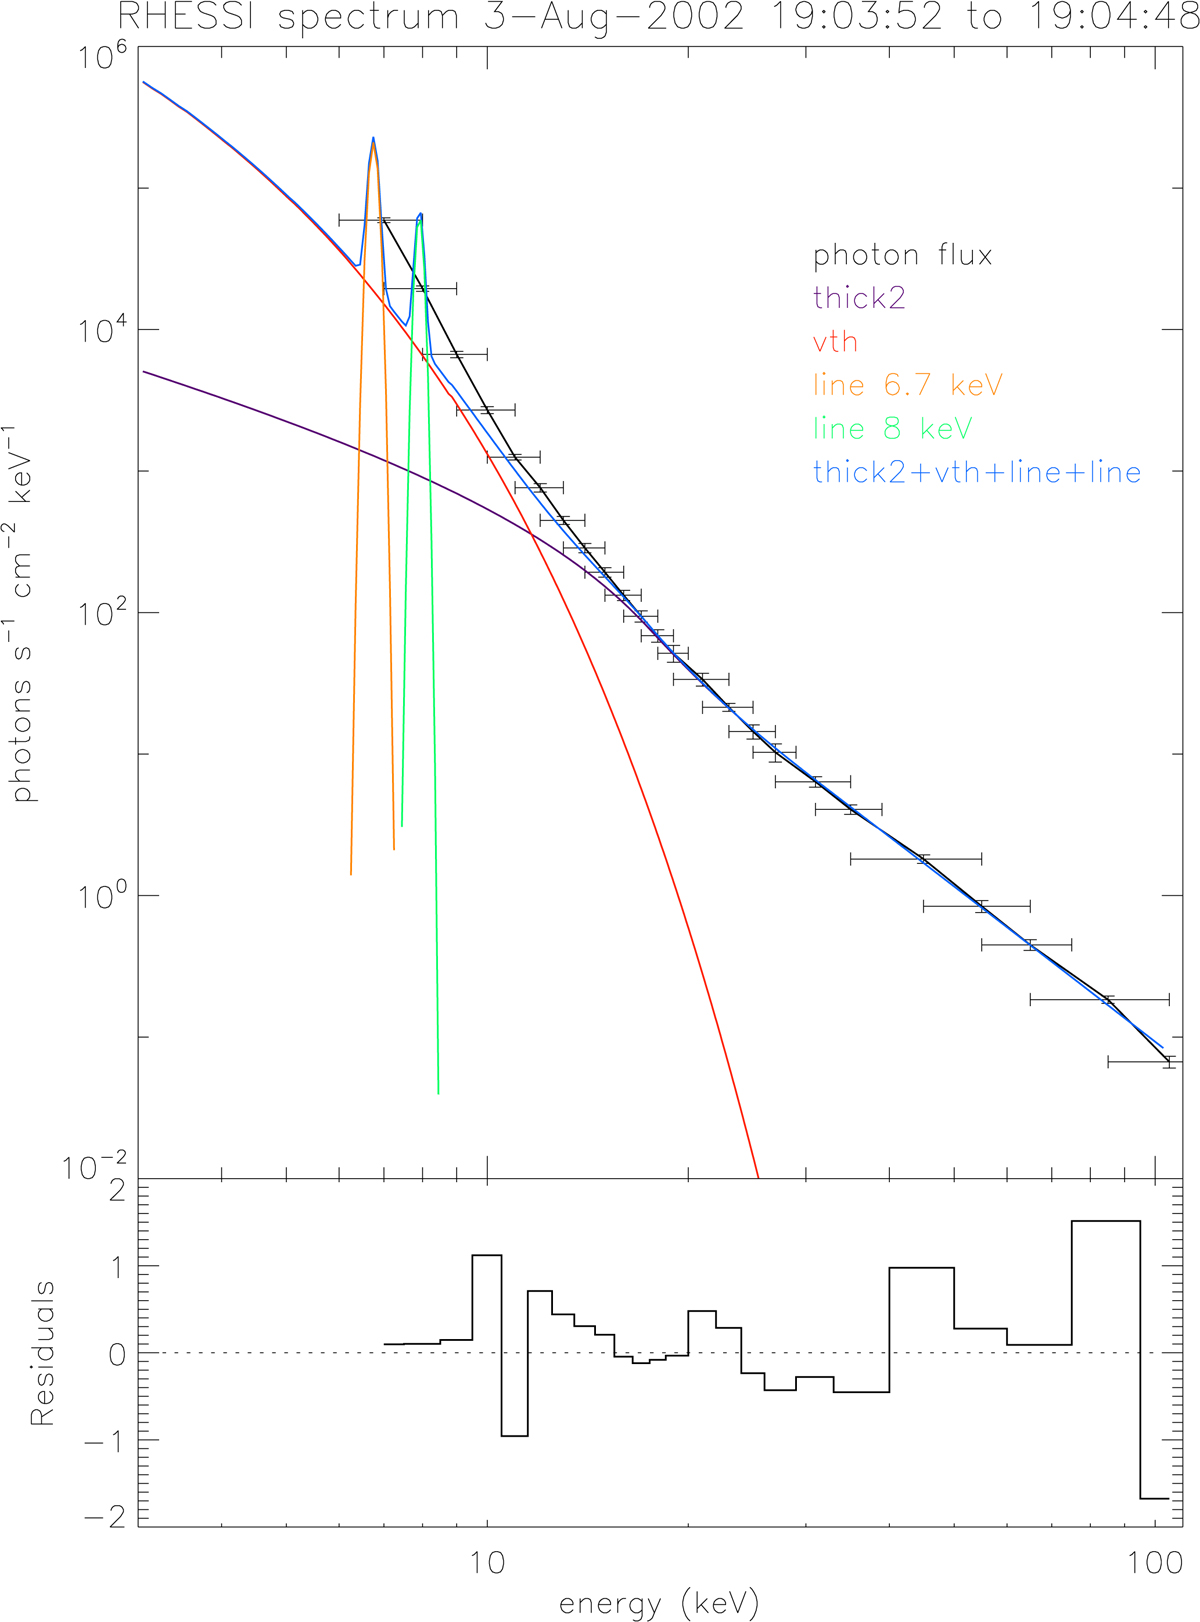
Example of fit to RHESSI spectrum. Top panel: RHESSI photon flux (error bars) registered from the area marked in Fig. 3 during the entire 19:04–19:05 UT peak. Components of the fit used are as follows: thermal continuum (red), thick-target model (violet), and the Fe (6.7 keV) and Ni (8.0 keV) line complexes (orange and green Gaussians, respectively). The sum of the components is presented with the light blue line. Bottom panel: normalised residuals (sigma) for the spectral fit.
Current usage metrics show cumulative count of Article Views (full-text article views including HTML views, PDF and ePub downloads, according to the available data) and Abstracts Views on Vision4Press platform.
Data correspond to usage on the plateform after 2015. The current usage metrics is available 48-96 hours after online publication and is updated daily on week days.
Initial download of the metrics may take a while.