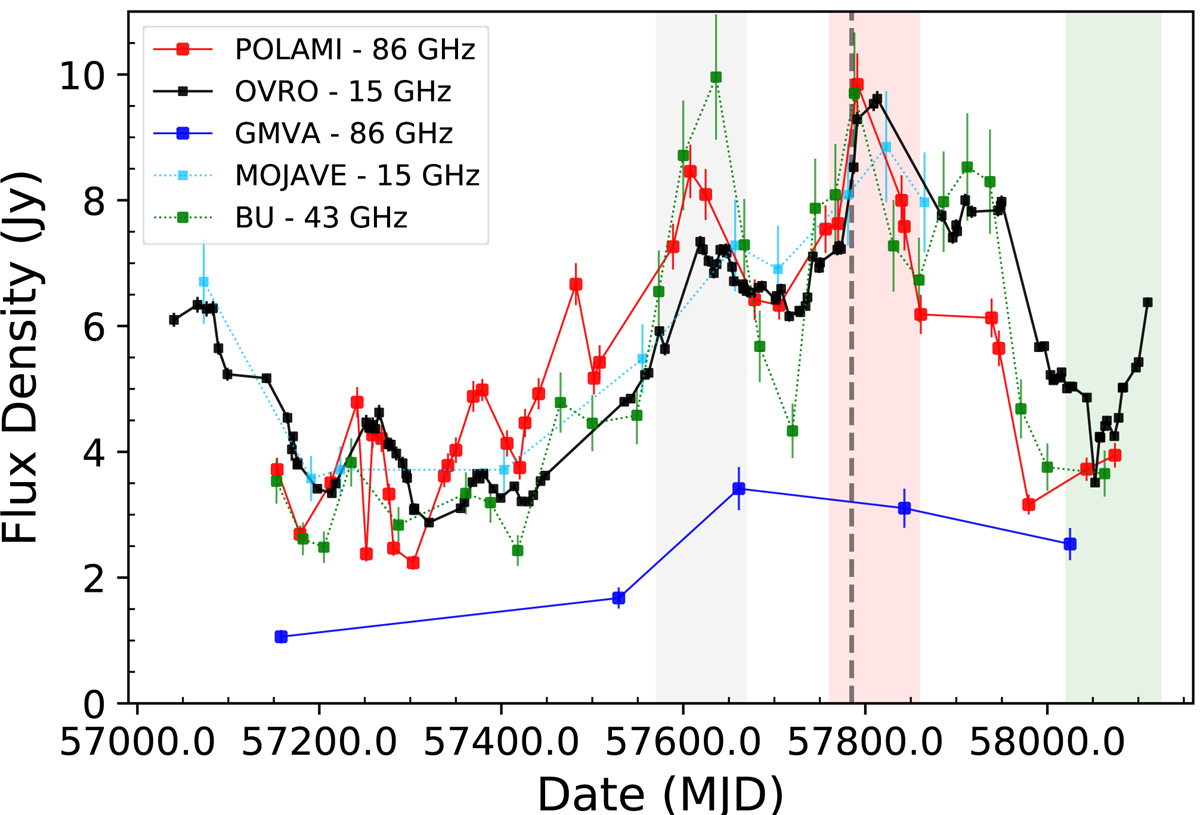
Fig. 3.
Download original image
Multiwavelength light curves: 15 GHz single-dish OVRO (black circles), 86 GHz single-dish POLAMI program (red circles), 86 GHz GMVA (dark blue circles), 15 GHz VLBA MOJAVE program (light blue circles), and 43 GHz VLBA-BU-BLAZAR program (green circles) observations from 2015 to 2017. The vertical dashed line represents the time of the TeV detection (MJD 57785). The shaded gray, red, and green areas represent periods of enhanced emission activity (see Sects. 3.2 and 4 for more details).
Current usage metrics show cumulative count of Article Views (full-text article views including HTML views, PDF and ePub downloads, according to the available data) and Abstracts Views on Vision4Press platform.
Data correspond to usage on the plateform after 2015. The current usage metrics is available 48-96 hours after online publication and is updated daily on week days.
Initial download of the metrics may take a while.