Fig. 2.
Download original image
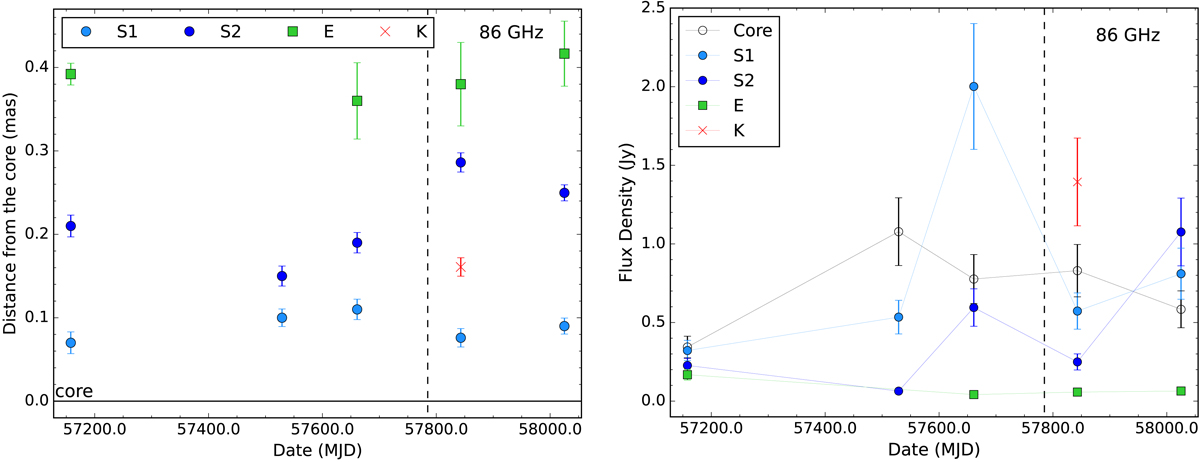
Time evolution of the position and flux density for each model-fit component. Left image: time evolution of the distance from the core (represented by the horizontal solid black line) of each model-fit component. The light and dark blue circles represent components S1 and S2, respectively. The green squares and red crosses represent components E and K, respectively. The vertical dashed line represents the TeV detection (MJD 57785). Right image: light curves for each model-fit component. The core component is represented by the empty black circles, and all the other symbols are as in the left image. The nominal total intensity emission uncertainties were calculated by considering a calibration error of ∼20% of the flux density and a statistical error equal to three times the map rms noise, but no amplitude scaling factors are provided in this work (see Sect. 2 for more details).
Current usage metrics show cumulative count of Article Views (full-text article views including HTML views, PDF and ePub downloads, according to the available data) and Abstracts Views on Vision4Press platform.
Data correspond to usage on the plateform after 2015. The current usage metrics is available 48-96 hours after online publication and is updated daily on week days.
Initial download of the metrics may take a while.