Fig. 1.
Download original image
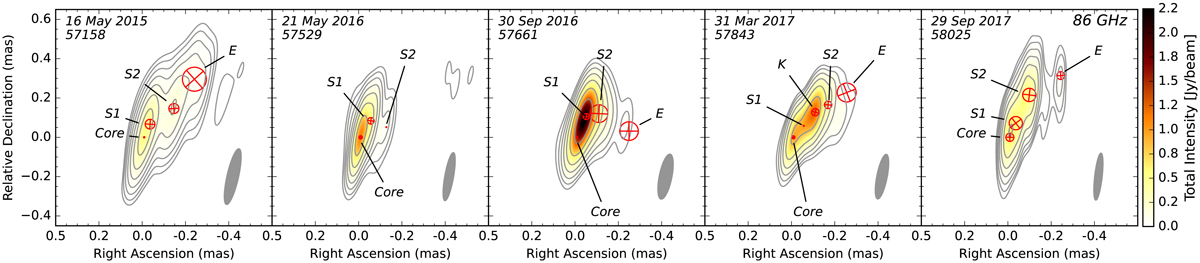
Natural weighted total intensity images for the five 86 GHz GMVA observing epochs from 2015 (left) to 2017 (right). The MJD epoch is indicated in the top-left corner in each image. The restoring beam size, shown in the bottom-right corner in each image, is 0.29 mas × 0.06 mas (at −12.8°), 0.25 mas × 0.04 mas (at −10.1°), 0.23 mas × 0.06 mas (at −11.5°), 0.21 mas × 0.05 mas (at −11.2°), and 0.24 mas × 0.04 mas (at −6.5°) from left to right, respectively. The overlaid lowest total intensity contour is at 1% of the map peak (0.54, 1.11, 2.30, 2.53, and 0.68 Jy beam−1 from left to right, respectively), with the contours that follow a factor of two higher. The image rms noise from left to right is 0.54, 1.03, 2.71, 4.15, and 3.47 mJy beam−1, respectively. The color scale represents the total intensity. The overlaid red circles represent the model-fit components.
Current usage metrics show cumulative count of Article Views (full-text article views including HTML views, PDF and ePub downloads, according to the available data) and Abstracts Views on Vision4Press platform.
Data correspond to usage on the plateform after 2015. The current usage metrics is available 48-96 hours after online publication and is updated daily on week days.
Initial download of the metrics may take a while.