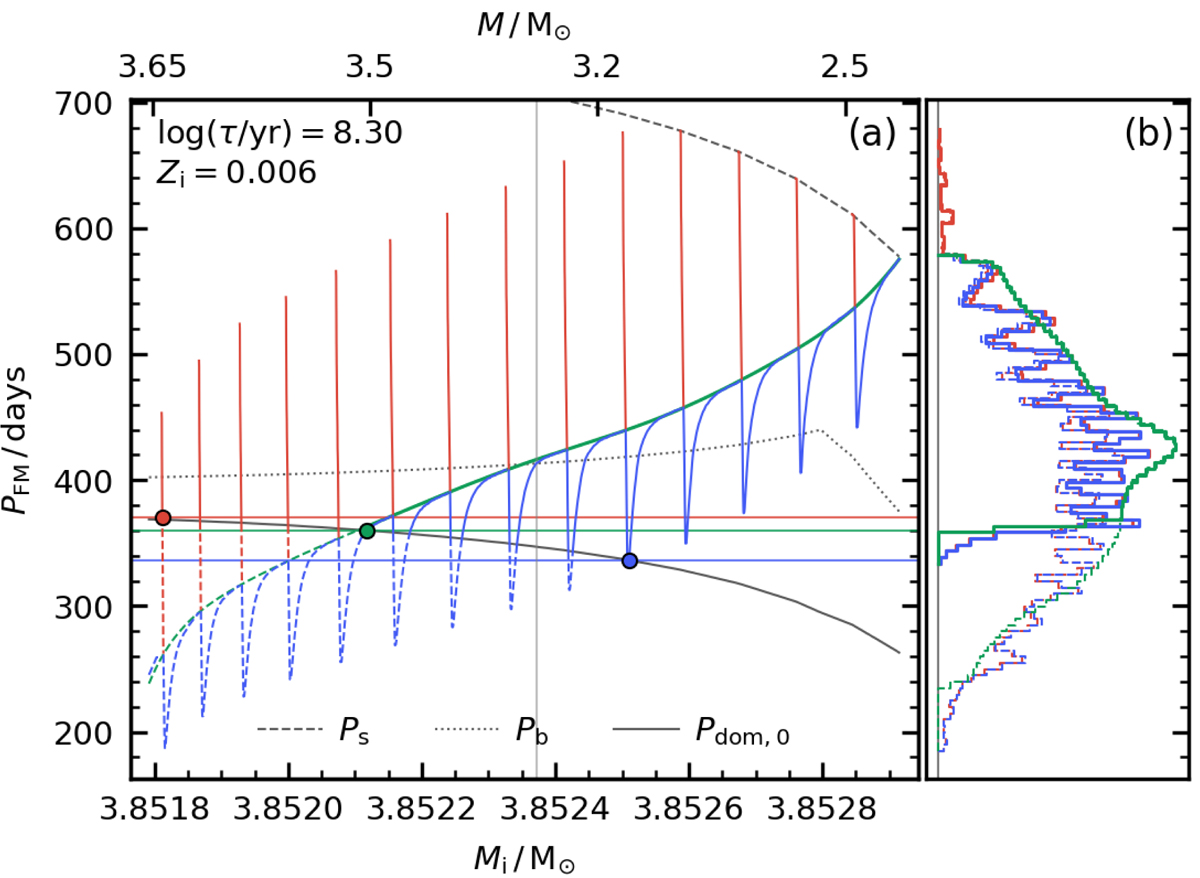
Fig. C.1.
Download original image
Period distribution at fixed age and metallicity. Panel (a) shows period as a function of initial mass (current mass on the top axis) on the TP-AGB for a ∼200 Myr old isochrone with Zi = 0.006. Red lines show full thermal pulses, while blue lines ignore luminosity spikes and green lines show only the quiescent evolution. The same color code is used for the period distributions (normalized to their maximum) on panel (b). Solid lines indicate that the FM is dominant. Circles indicate the earliest onset of DFMP accounting for (red) or ignoring (green) luminosity spikes, and the shortest period of the dominant FM (blue). Gray lines mark the critical values of periods at which the FM becomes dominant (solid line), less sensitive to radius (dotted line, which occurs at the vertical line for this specific isochrone), and independent of radius (dashed line).
Current usage metrics show cumulative count of Article Views (full-text article views including HTML views, PDF and ePub downloads, according to the available data) and Abstracts Views on Vision4Press platform.
Data correspond to usage on the plateform after 2015. The current usage metrics is available 48-96 hours after online publication and is updated daily on week days.
Initial download of the metrics may take a while.