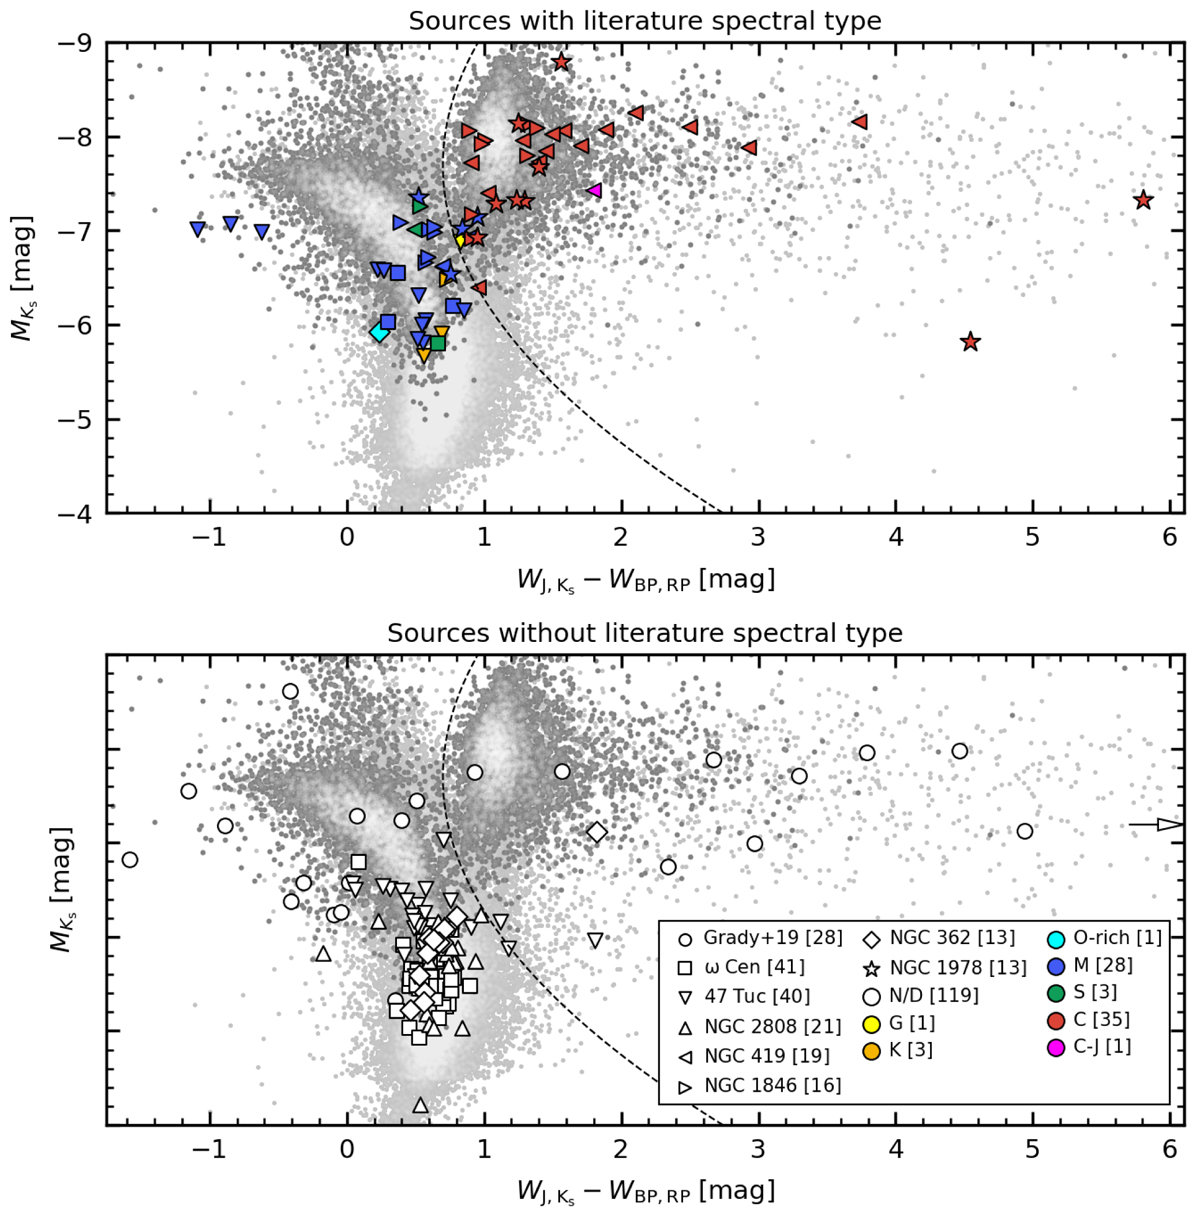
Fig. A.1.
Download original image
Absolute-KsGaia-2MASS diagram for the stars with or without a spectral type (top and bottom panels, respectively) in the selected sample. Symbol colors and shapes indicate the spectral type and host cluster described in the legend, respectively, which also reports the number of sources displayed (i.e., having both optical and NIR photometry). The dashed line marks the separation between O- and C-rich sources according to Lebzelter et al. (2018). An arrow marks the source MSX LMC 124 in NGC 1830 that, having WBP,RP − WJ,K_s = 9.73 mag, lies outside the plot area. Background dots are LPVs in the LMC from OGLE-III (light gray) and Mowlavi et al. (2018) (darker gray).
Current usage metrics show cumulative count of Article Views (full-text article views including HTML views, PDF and ePub downloads, according to the available data) and Abstracts Views on Vision4Press platform.
Data correspond to usage on the plateform after 2015. The current usage metrics is available 48-96 hours after online publication and is updated daily on week days.
Initial download of the metrics may take a while.