Fig. 1.
Download original image
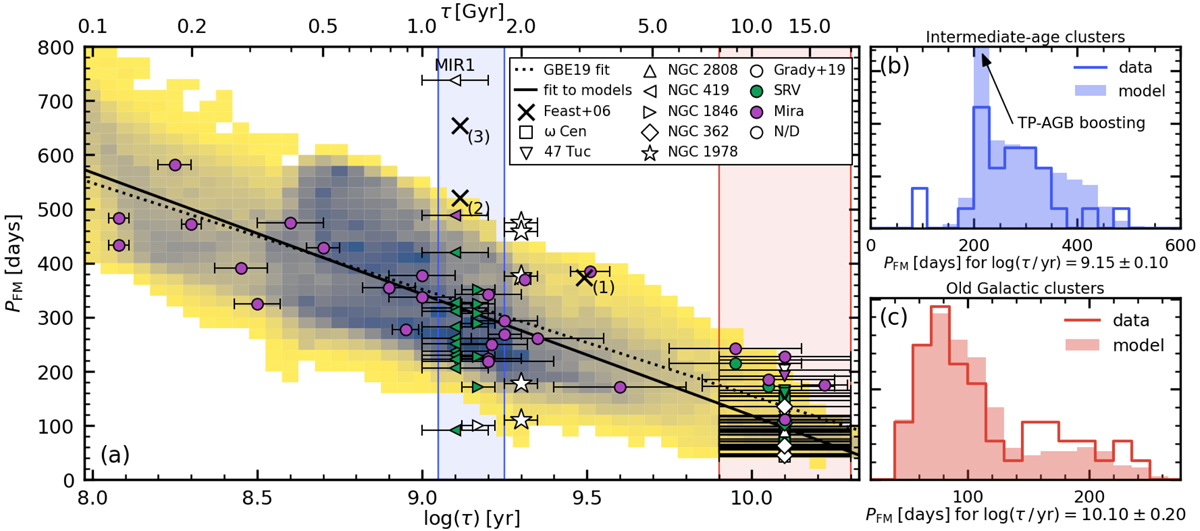
Period-age diagram. Panel a shows the predicted period-age distribution (darker tones indicate a higher expected number of LPVs on a linear scale, normalized to maximum). Symbols represent observed LPVs (green: SRVs; purple: Miras; white: unclassified) with the shape indicating their host cluster or literature source as indicated in the legend. The age uncertainties are marked by the error bars. The groups of galactic C-stars of Feast et al. (2006) are marked by crosses annotated with the group number. The solid and dotted line represent a linear best-fit to models and the best-fit by Grady et al. (2019), respectively. Period distributions at selected ages are compared in panels b and c and marked in panel a by the blue and red shaded areas (at log(τ/yr) ∼ 9.15 and ∼10.10, respectively). For clarity, the effect of the TP-AGB boosting is suppressed in panel a.
Current usage metrics show cumulative count of Article Views (full-text article views including HTML views, PDF and ePub downloads, according to the available data) and Abstracts Views on Vision4Press platform.
Data correspond to usage on the plateform after 2015. The current usage metrics is available 48-96 hours after online publication and is updated daily on week days.
Initial download of the metrics may take a while.