Fig. 8
Download original image
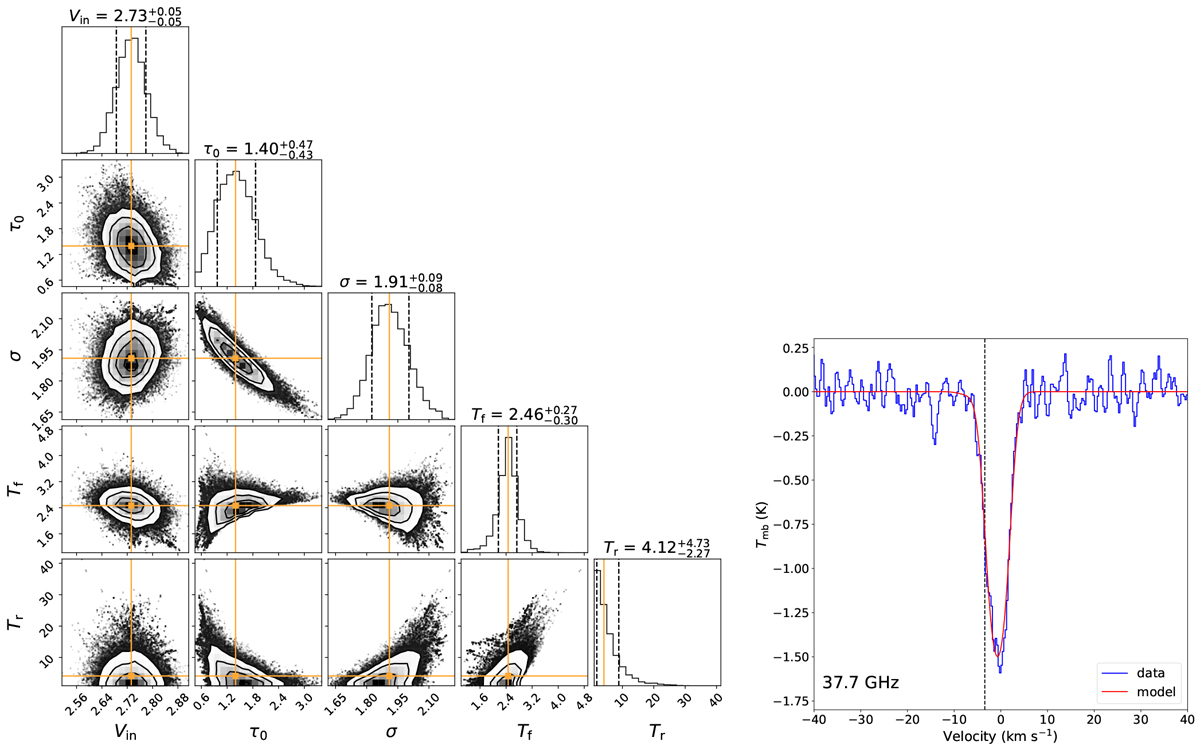
Left: posterior probability distributions of infall velocity, Vin, peak optical depth, τ0, velocity dispersion, σ, excitation temperature of the “front” layer, Tf, and excitation temperature of the “rear” layer, Tr for the 37.7 GHz CH3OH transitiontowards W31C. The maximum posterior possibility point in the parameter space is shown in orange lines and points. The contours represent the 0.5, 1.0, 1.5, and 2.0σ confidence intervals. Right: observed and modelled spectra for the 37.7 GHz CH3OH transition. The blue spectrum represents the observed data, and the red curve indicates the fitted line from the two-layer model (see Sect. 4.1). The vertical black dashed line represents the systemic velocity of VLSR = −3.43 km s−1.
Current usage metrics show cumulative count of Article Views (full-text article views including HTML views, PDF and ePub downloads, according to the available data) and Abstracts Views on Vision4Press platform.
Data correspond to usage on the plateform after 2015. The current usage metrics is available 48-96 hours after online publication and is updated daily on week days.
Initial download of the metrics may take a while.