Fig. 5
Download original image
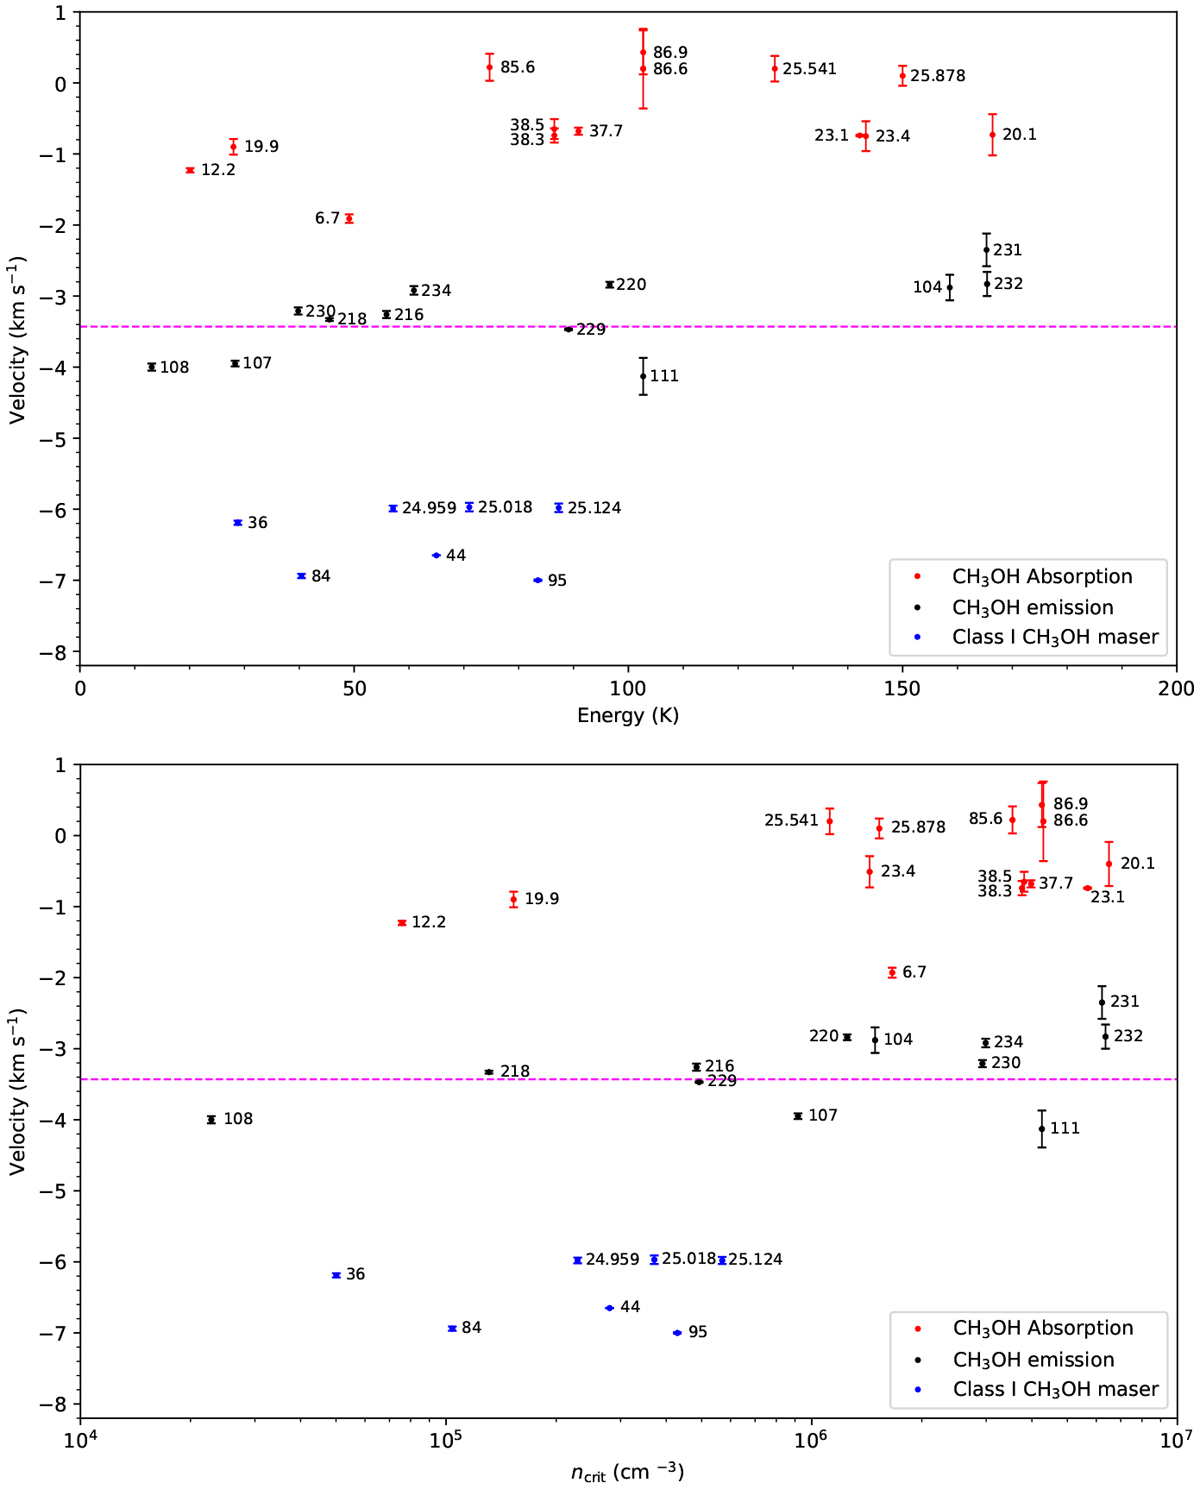
LSR velocity as a function of the upper energy level (upper panel) and critical density (lower panel) for W31C. The red and blue dots indicate the methanol lines with absorption features and maser features, respectively. The black dots indicate the methanol emission without a narrow and strong maser emission feature. We only show the J2 − J1E lines with absorption features or maser features in the panels. Their velocities are derived from Gaussian fitting to the emission peaks or absorption dips. The error bars indicate Gaussian fitting errors. The horizontal magenta dashed line represents the systemic velocity of VLSR = −3.43 km s−1.
Current usage metrics show cumulative count of Article Views (full-text article views including HTML views, PDF and ePub downloads, according to the available data) and Abstracts Views on Vision4Press platform.
Data correspond to usage on the plateform after 2015. The current usage metrics is available 48-96 hours after online publication and is updated daily on week days.
Initial download of the metrics may take a while.