Fig. 4
Download original image
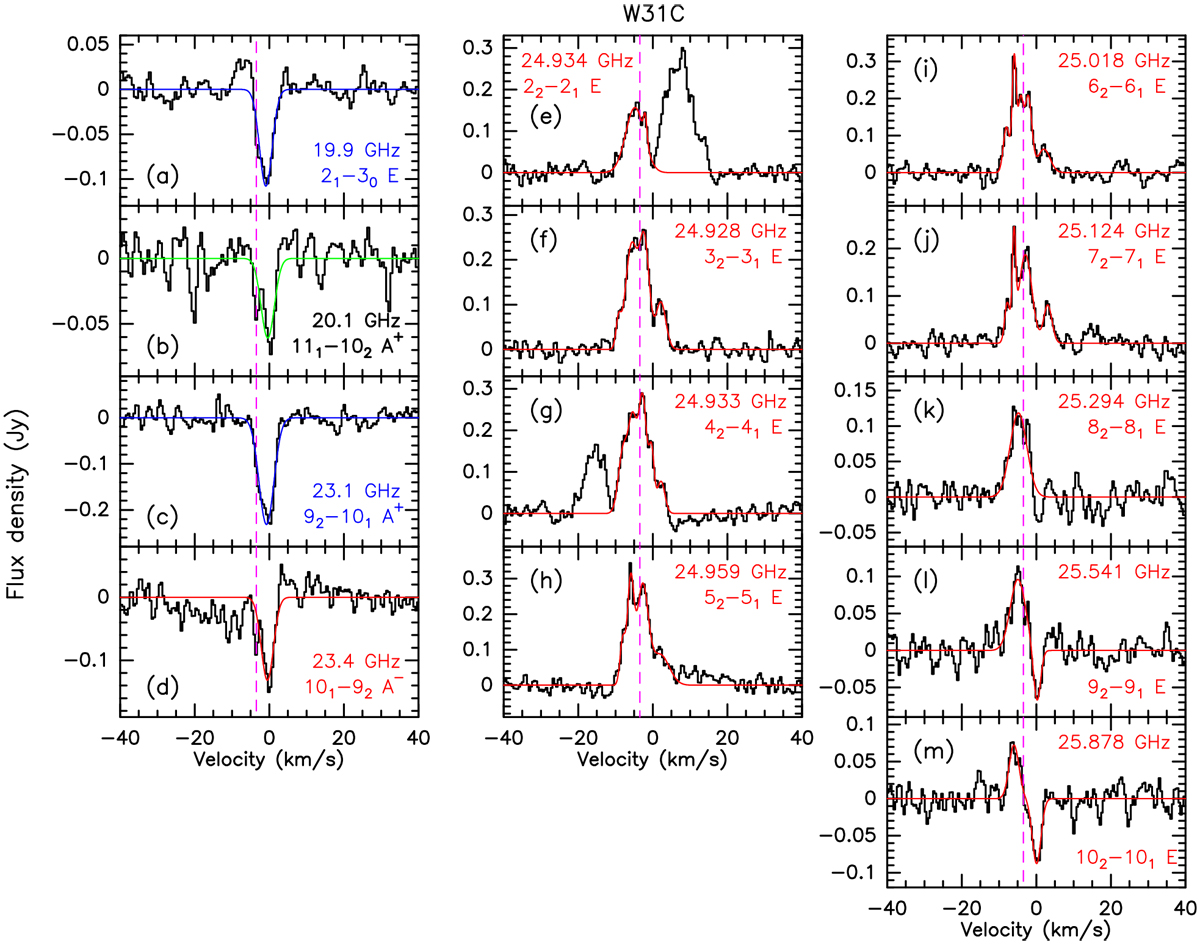
Observed spectra of CH3OH transitions in K-band (18–26 GHz) towards W31C. The panels from (a) to (m) are arranged based on increasing frequency or increasing J for the J2 − J1E line series. The quantum numbers and rest frequencies of transitions are labelled in their respective panels. Class I and II CH3OH maser transitions are labelled in red and blue, respectively, and their Gaussian fitting results are plotted in the corresponding colour. The transitions that have no maser detection yet are labelled in black, and the Gaussian fitting results are plotted in green. The vertical magenta dashed lines represent the systemic velocity of VLSR = −3.43 km s−1.
Current usage metrics show cumulative count of Article Views (full-text article views including HTML views, PDF and ePub downloads, according to the available data) and Abstracts Views on Vision4Press platform.
Data correspond to usage on the plateform after 2015. The current usage metrics is available 48-96 hours after online publication and is updated daily on week days.
Initial download of the metrics may take a while.