Fig. 10
Download original image
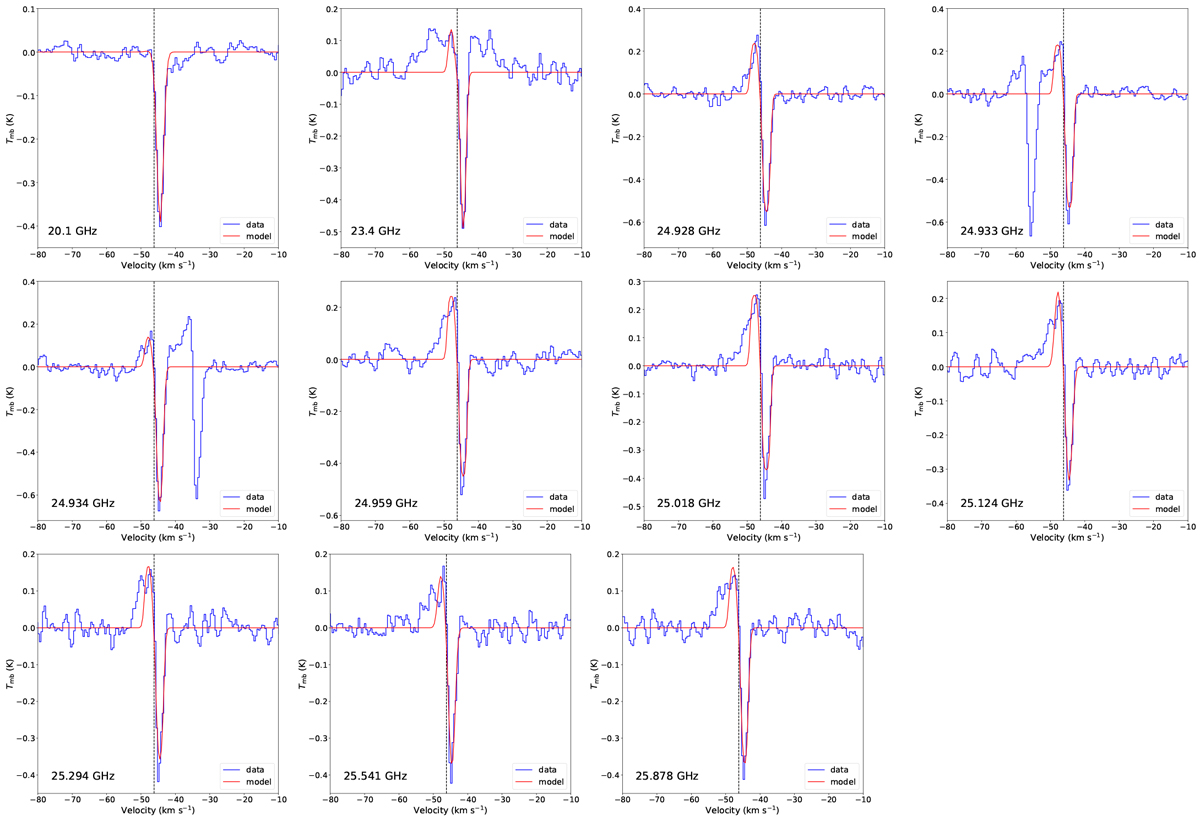
Observed and modelled spectra for the methanol transitions with absorption features towards W3(OH). The short line name of each transition is denoted in the lower left corner of each panel. The blue spectra represent the observed data, and the red curves indicate the fitted line from the two-layer model with adopted parameters listed in Table A.5. The vertical black dashed lines represent the systemic velocity of VLSR = −46.19 km s−1.
Current usage metrics show cumulative count of Article Views (full-text article views including HTML views, PDF and ePub downloads, according to the available data) and Abstracts Views on Vision4Press platform.
Data correspond to usage on the plateform after 2015. The current usage metrics is available 48-96 hours after online publication and is updated daily on week days.
Initial download of the metrics may take a while.