Fig. A.2.
Download original image
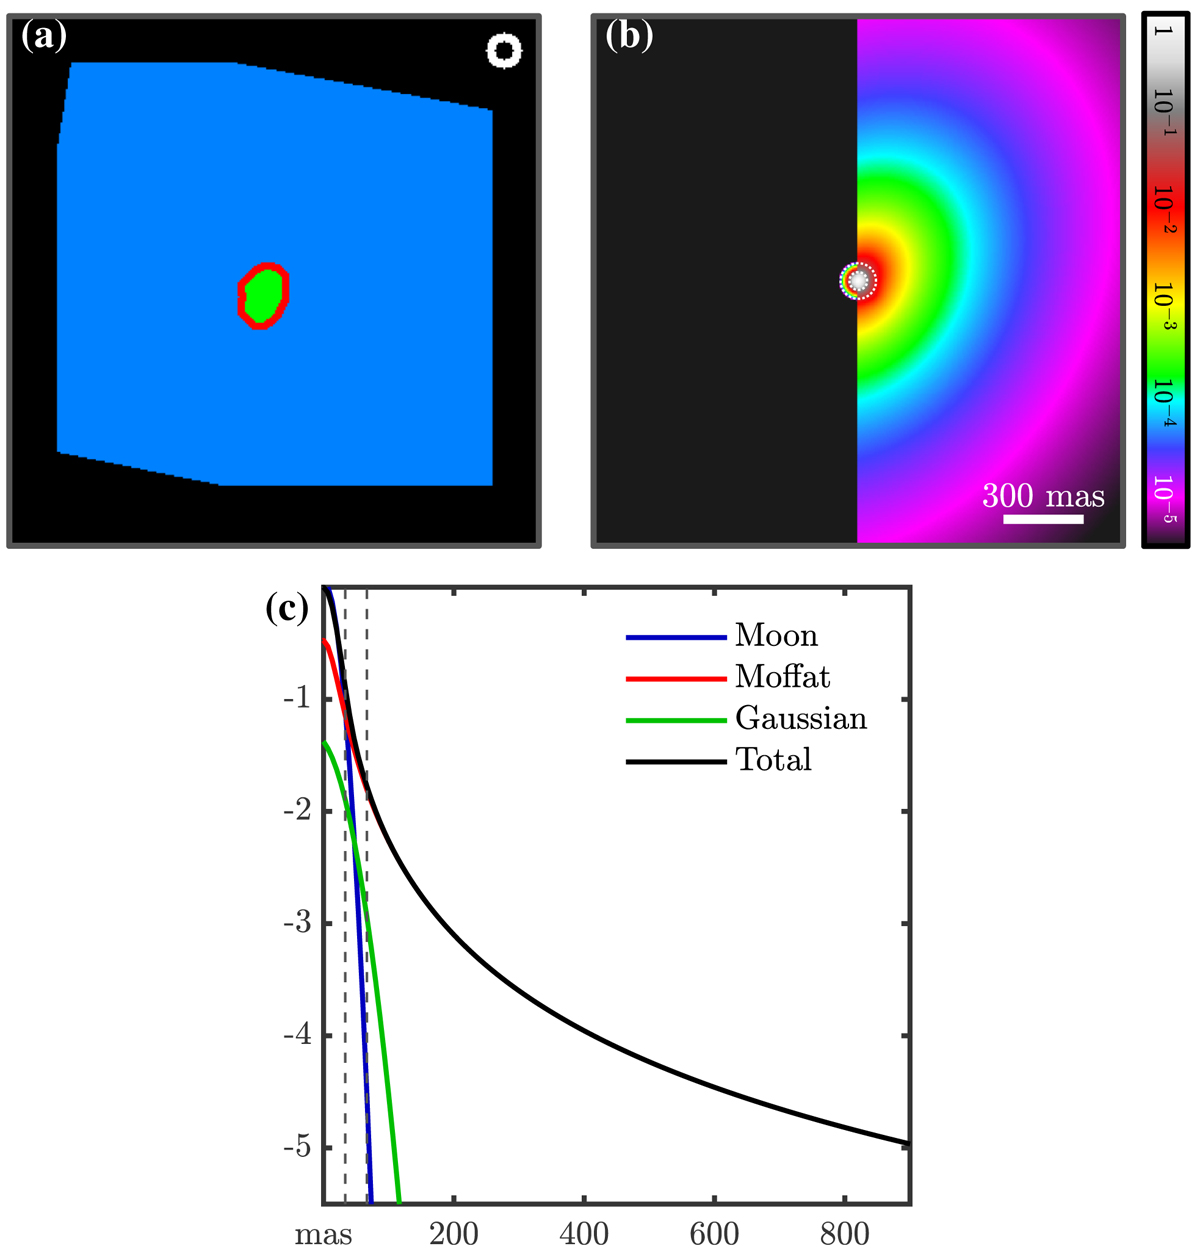
Fitting the PSF wings from Figs. 1(b,c) and Fig. A.1(b). (a) Map of the different mask on the pixel. Green: pixels of the primary after segmentation. Red: pixels removed after the primary mask erosion. Black: pixels outside the IFS field of view. Blue: pixels on which the halo was fitted and the median filter applied. It should be noted that the annulus filter is displayed in white. (b) Comparison of the core of the PSF pcore of Fig. A.1(b) (left) with the total PSF pcore + pwing fitted by accounting for the halo (right) (logarithmic scale). The dotted white lines emphasise the edges of the annulus median filter. (c) x-profiles of (b) (logarithmic scale). The different components of the PSF are emphasised by different colours. Blue: PSF core pcore fitted on the brightest moon (normalised to its maximal value). Black: total PSF pcore + pwing (normalised to its maximal value). Red: Moffat sub-part m of the PSF wings pwing (normalised to the total PSF maximal value). Green: Gaussian sub-part g of the PSF wings pwing (normalised to the total PSF maximal value). Dashed grey lines: edges of the annulus median filter.
Current usage metrics show cumulative count of Article Views (full-text article views including HTML views, PDF and ePub downloads, according to the available data) and Abstracts Views on Vision4Press platform.
Data correspond to usage on the plateform after 2015. The current usage metrics is available 48-96 hours after online publication and is updated daily on week days.
Initial download of the metrics may take a while.