Fig. 2.
Download original image
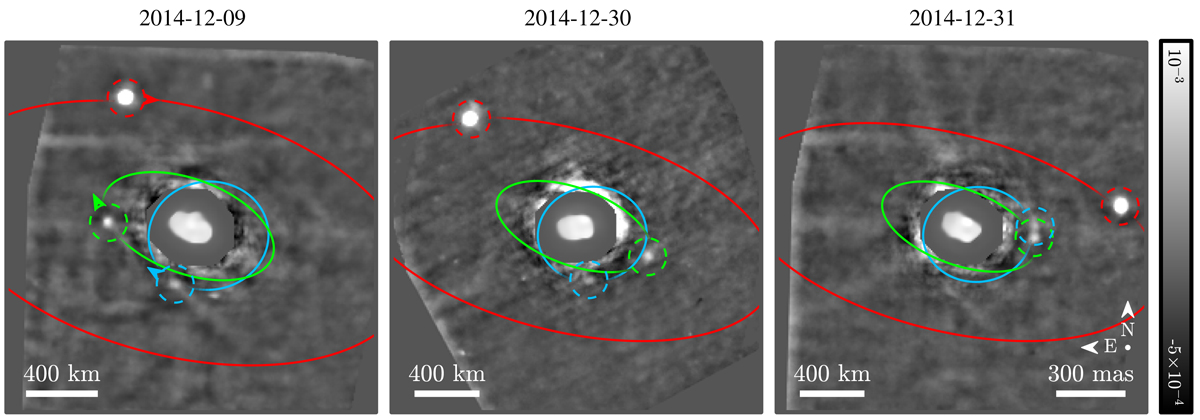
Median projection of the temporal cubes for the different dates reduced with the PIC pipeline (Berdeu et al. 2020). The fitted orbits are projected on the different dates: S1 in red, S2 in green, and S3 in blue. The arrows indicate the projected motion direction. The dashed circles indicate the median fitted moon position during the acquisitions at each date. The central part of the field of view has been replaced by a dimmer deconvolved image of Elektra to simultaneously visualise the primary and the moons.
Current usage metrics show cumulative count of Article Views (full-text article views including HTML views, PDF and ePub downloads, according to the available data) and Abstracts Views on Vision4Press platform.
Data correspond to usage on the plateform after 2015. The current usage metrics is available 48-96 hours after online publication and is updated daily on week days.
Initial download of the metrics may take a while.