Fig. 3
Download original image
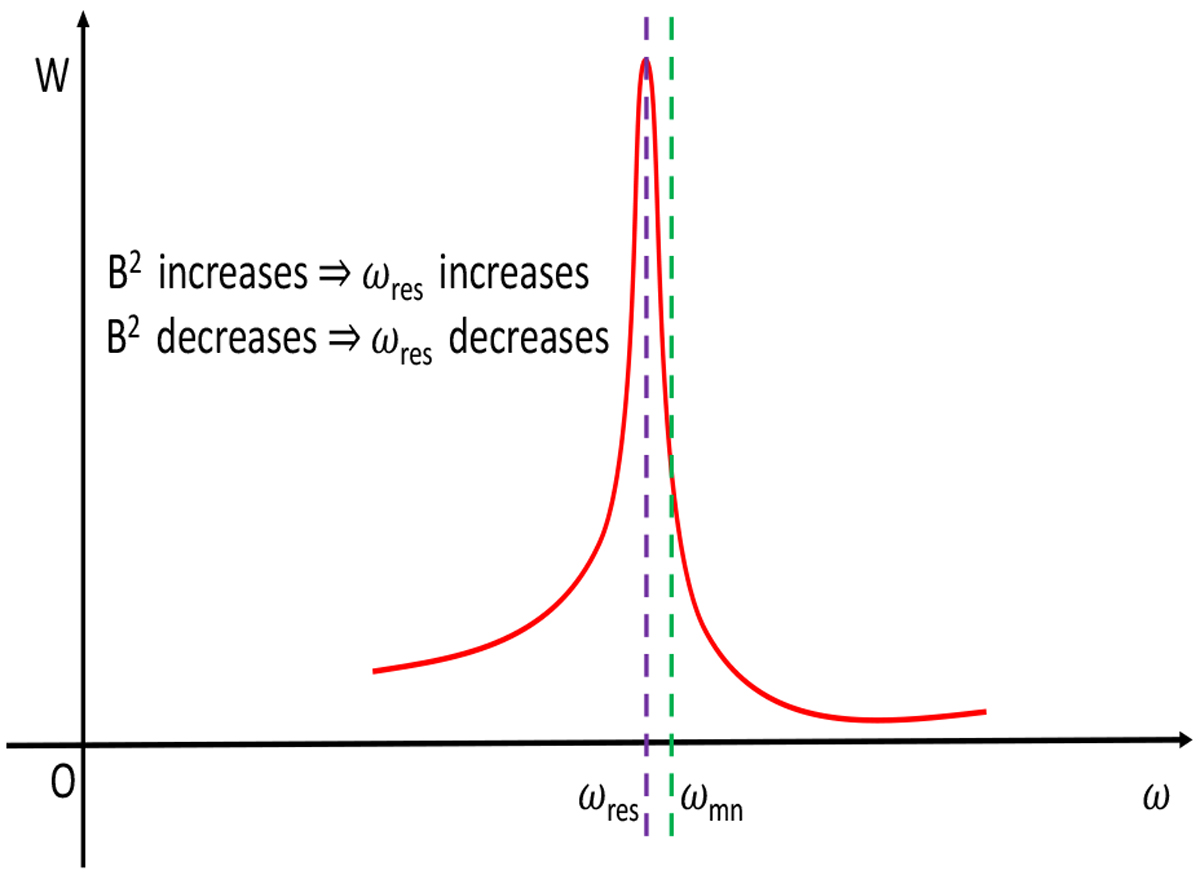
Resonance amplification factor, W, vs. frequency of oscillation, ω (solid red line). The vertical dashed violet line marks the resonance peak at ω = ωres, and the dashed green line indicates the frequency of the tidal potential component that is responsible for exciting the oscillations, ωmn. When the magnetic field, B, of the flux tube increases, the resonance peak moves toward the right because ωres increases. On the contrary, when the magnetic field strength decreases, the peak moves toward the left. Therefore, the perturbationΔB2 produced by the oscillation displacement, ξr, can lock the system into resonance, with ωmn being slightly greater than ωres, as illustrated (see text).
Current usage metrics show cumulative count of Article Views (full-text article views including HTML views, PDF and ePub downloads, according to the available data) and Abstracts Views on Vision4Press platform.
Data correspond to usage on the plateform after 2015. The current usage metrics is available 48-96 hours after online publication and is updated daily on week days.
Initial download of the metrics may take a while.