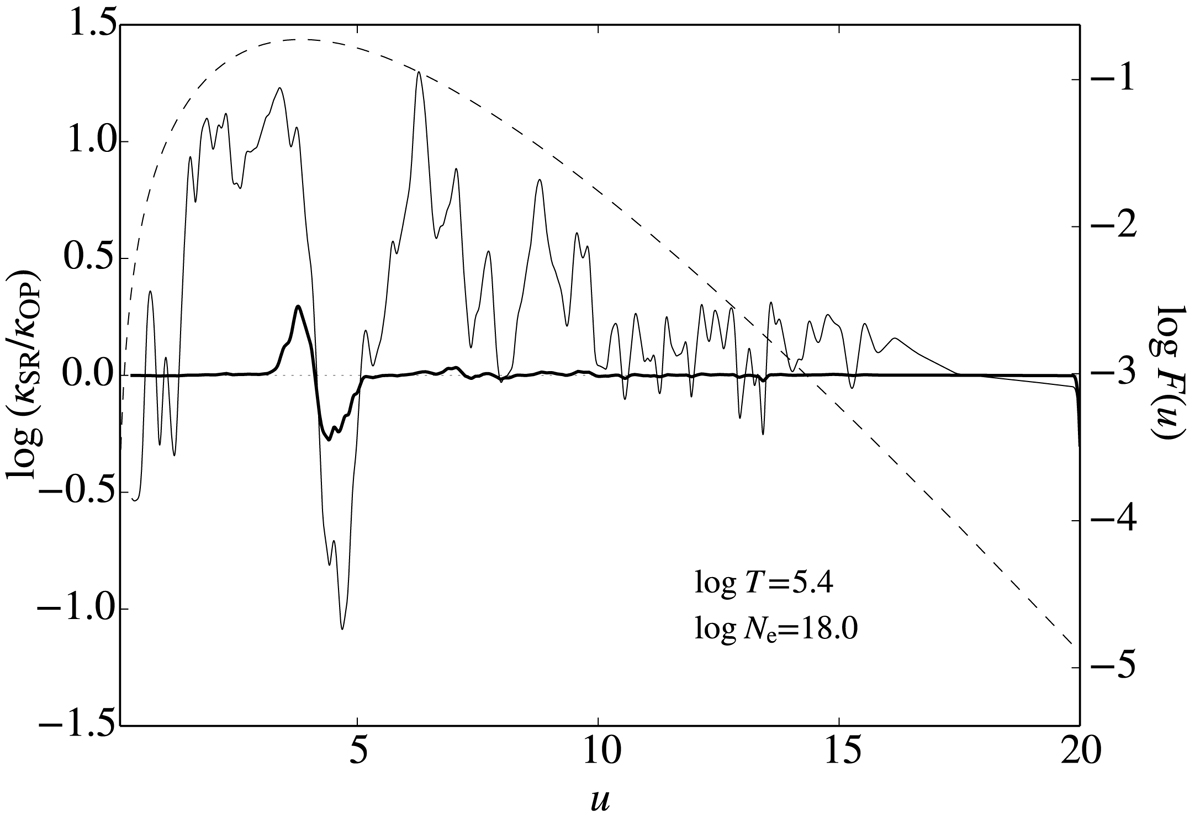
Fig. 7.
Download original image
Logarithm of the ratio of the monochromatic cross sections for the stellar mixture with the new Ni data (κSR) and those with the OP Ni data (κOP) vs. u, and the same quantity for Ni alone (thick and thin solid lines, respectively, left scale). The dashed line shows the F(u) function (right scale). The dotted line represents a ratio of one. For the sake of legibility, the spectra have been convolved with a Gaussian kernel with a standard deviation of 0.05.
Current usage metrics show cumulative count of Article Views (full-text article views including HTML views, PDF and ePub downloads, according to the available data) and Abstracts Views on Vision4Press platform.
Data correspond to usage on the plateform after 2015. The current usage metrics is available 48-96 hours after online publication and is updated daily on week days.
Initial download of the metrics may take a while.