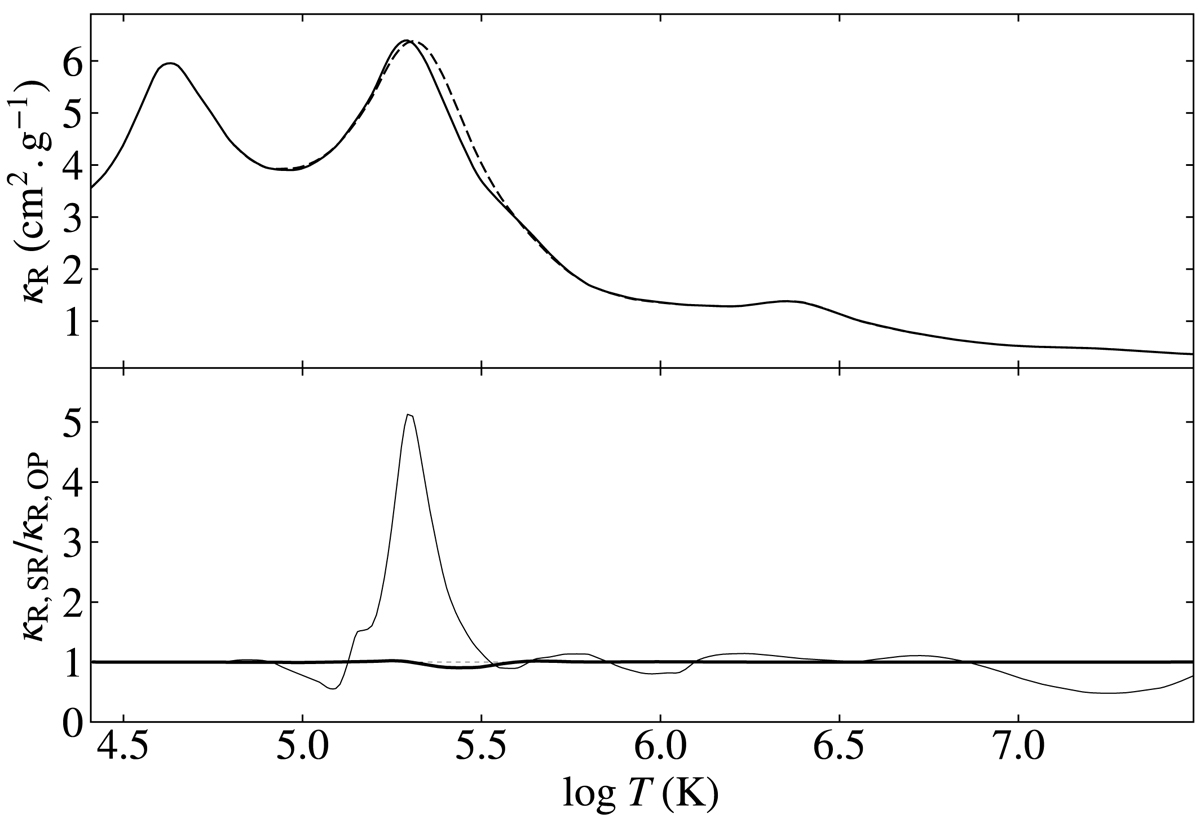
Fig. 6.
Download original image
Comparison of the mean opacities of a stellar model computed with the new Ni data and one with the OP data. Upper panel: Rosseland mean (κR) of the stellar mixture with the new Ni data (solid line) and that with OP (dashed line) vs. log T. Lower panel: ratio of the SCO-RCG (κR, SR) and OP (κR, OP) Rosseland means vs. log T for the stellar mixture (thick line) and for Ni alone (thin line). The dotted line represents a ratio of one.
Current usage metrics show cumulative count of Article Views (full-text article views including HTML views, PDF and ePub downloads, according to the available data) and Abstracts Views on Vision4Press platform.
Data correspond to usage on the plateform after 2015. The current usage metrics is available 48-96 hours after online publication and is updated daily on week days.
Initial download of the metrics may take a while.