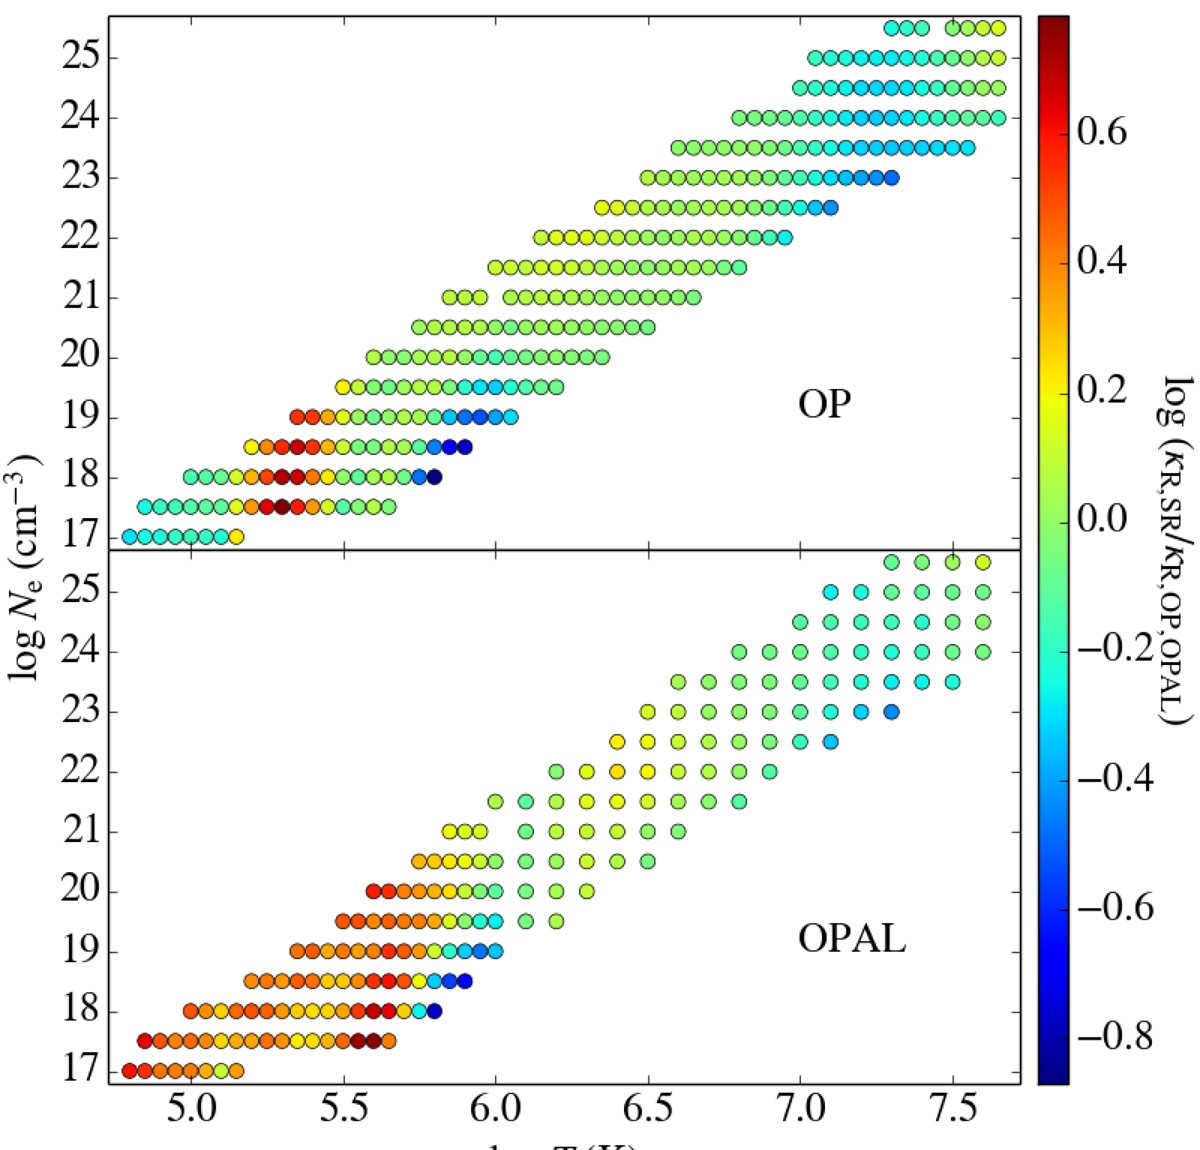
Fig. 4.
Download original image
Ratios of the SCO-RCG Rosseland means and those of OP or OPAL in the (T, Ne) plane. κR, SR is the RMO from the new data and κR, OP, OPAL that of the comparison dataset. Top panel: comparison with OP. The SCO-RCG RMOs can be up to six times larger than those of OP in a narrow band in the Z-bump, around log T = 5.3. Bottom panel: same plot with OPAL. The OPAL temperature step is larger for log T > 6. The area in which the SCO-RCG RMOs are higher than those of OPAL is larger than for OP.
Current usage metrics show cumulative count of Article Views (full-text article views including HTML views, PDF and ePub downloads, according to the available data) and Abstracts Views on Vision4Press platform.
Data correspond to usage on the plateform after 2015. The current usage metrics is available 48-96 hours after online publication and is updated daily on week days.
Initial download of the metrics may take a while.