Fig. 3.
Download original image
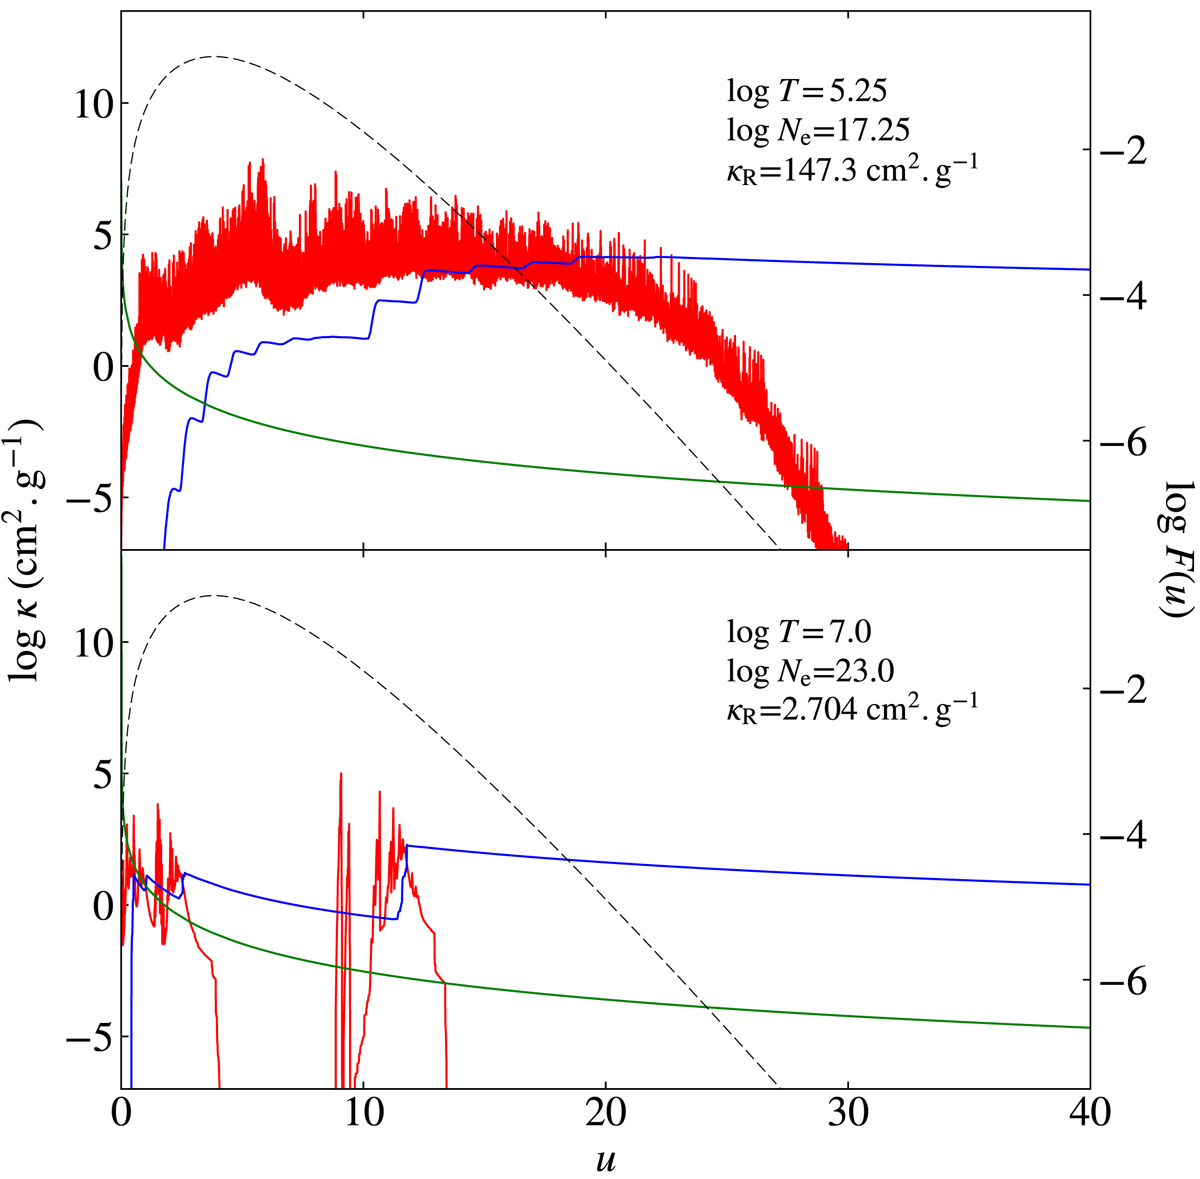
Spectra with the logarithm of the spectral lines (red lines), photoionisation (blue lines), and reverse-bremsstrahlung (green lines) cross sections (left scale) vs. photon energy expressed in ![]() for two different temperature-electron density sets. The conditions for which they have been computed and the resulting Rosseland mean are detailed in each panel. The dashed lines denote the normalised temperature derivative of the Planck function in logarithm, log F(u) (right scale).
for two different temperature-electron density sets. The conditions for which they have been computed and the resulting Rosseland mean are detailed in each panel. The dashed lines denote the normalised temperature derivative of the Planck function in logarithm, log F(u) (right scale).
Current usage metrics show cumulative count of Article Views (full-text article views including HTML views, PDF and ePub downloads, according to the available data) and Abstracts Views on Vision4Press platform.
Data correspond to usage on the plateform after 2015. The current usage metrics is available 48-96 hours after online publication and is updated daily on week days.
Initial download of the metrics may take a while.