Fig. 2.
Download original image
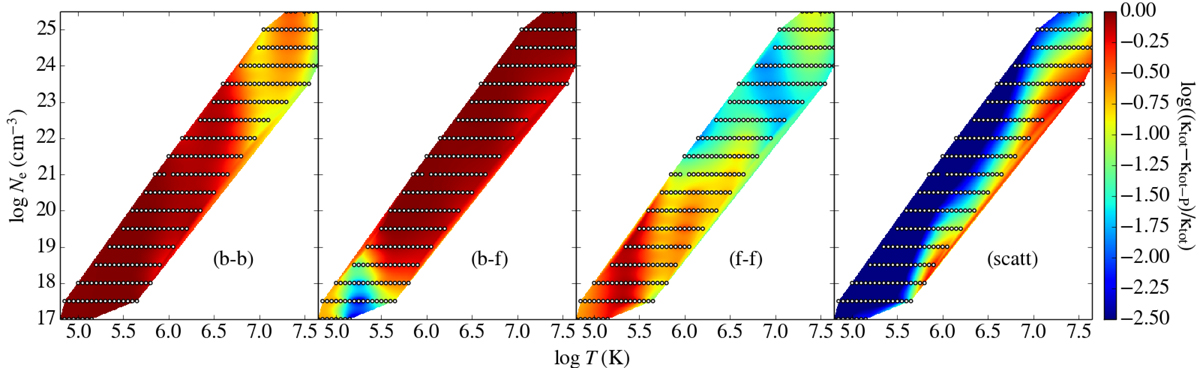
Logarithm of the contributions to the Rosseland mean opacities (see text) in the (T, Ne) plane, plotted according to the same scale. Its lower limit is set to −2.5, and the smallest scattering contributions are upper limits. κtot is the RMO considering all the absorption processes, κtot − P is the RMO without process P, P being one of the opacity sources (lines b-b, photoionisation b-f, reverse bremsstrahlung f-f, or scattering, scatt).
Current usage metrics show cumulative count of Article Views (full-text article views including HTML views, PDF and ePub downloads, according to the available data) and Abstracts Views on Vision4Press platform.
Data correspond to usage on the plateform after 2015. The current usage metrics is available 48-96 hours after online publication and is updated daily on week days.
Initial download of the metrics may take a while.