Fig. 4
Download original image
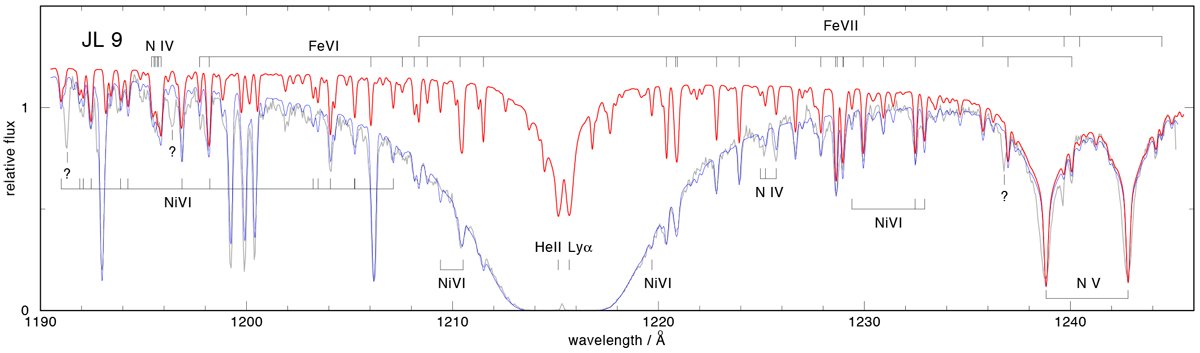
HST/STIS spectrum of the O(He) star JL 9 compared to the final model spectrum (red graph; Teff = 80 000 K, logg = 5.2) with the element abundances given in Table 4. The same model attenuated by interstellar lines is plotted in blue. Prominent photospheric lines are identified. Question marks indicate unidentified lines. A reddening of EB-V = 0.06 was applied to the model spectra.
Current usage metrics show cumulative count of Article Views (full-text article views including HTML views, PDF and ePub downloads, according to the available data) and Abstracts Views on Vision4Press platform.
Data correspond to usage on the plateform after 2015. The current usage metrics is available 48-96 hours after online publication and is updated daily on week days.
Initial download of the metrics may take a while.