Fig. 9
Download original image
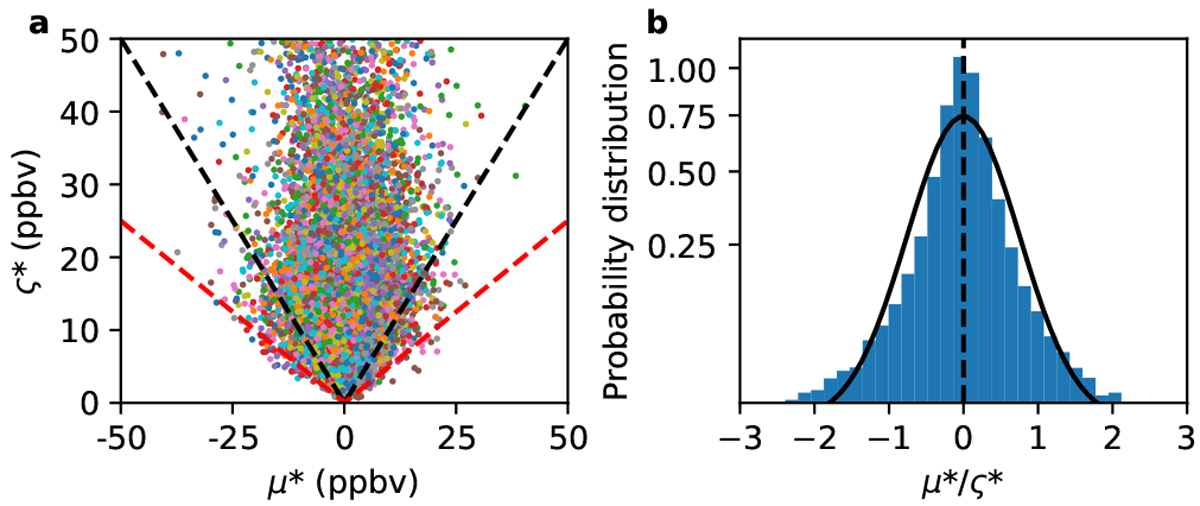
Statistical distribution of the retrieved values of μ* and ς* for OCS from all position 11 spectra in the analysed dataset. Panel a: scatter plot of μ* against ς*, with the dashed black line showing the 1σ detection threshold and the dashed red line showing the 2σ detection threshold. Panel b: normalised probability distribution of derived σ detection values, with the solid black line showing the Gaussian best fit to the probability distribution. While we find little skew in our upper limit retrievals, there is some kurtosis due to occasional overfitting of fixed pattern noise.
Current usage metrics show cumulative count of Article Views (full-text article views including HTML views, PDF and ePub downloads, according to the available data) and Abstracts Views on Vision4Press platform.
Data correspond to usage on the plateform after 2015. The current usage metrics is available 48-96 hours after online publication and is updated daily on week days.
Initial download of the metrics may take a while.