Fig. 8
Download original image
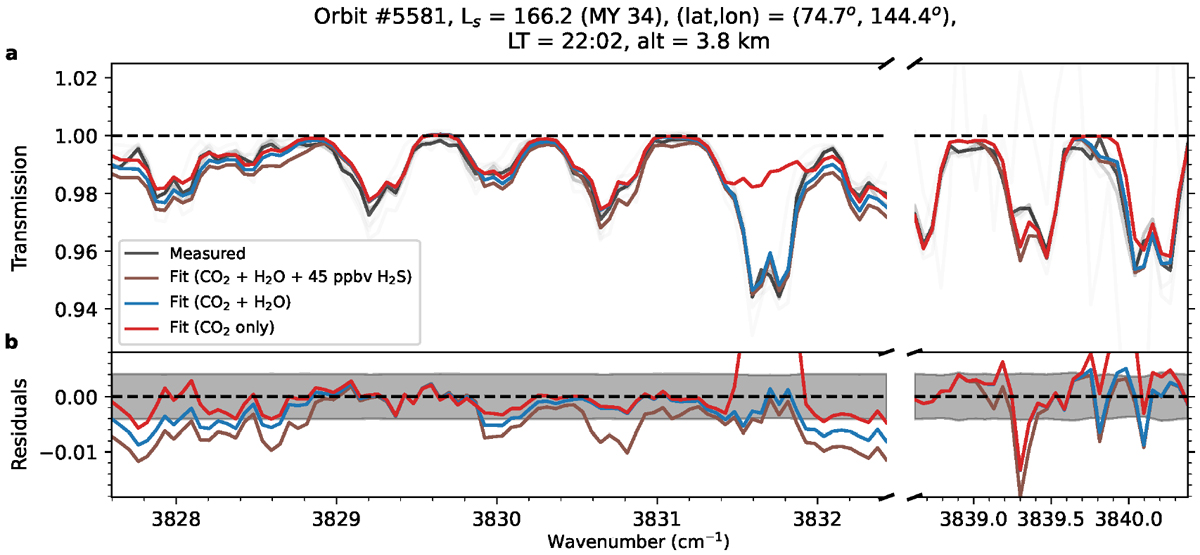
Upper limit of H2S from position 5 spectra. Panel a: fit to the spectrum with the lowest retrieved H2S upper limit in the position 5 dataset, with a 3σ value equivalent to 45 ppbv. In grey are the observed spectra at each row of the detector array normalised to the retrieved unity baseline (black, dashed): the darker the grey colour, the greater the weighting used for the calculation of μ* and ς*. The red and blue lines respectively show the contributions of each of the interfering gas species (in this case, CO2 and H2O) to the fit to the row of the detector array with the greatest S/N, while the brown line shows the synthetic spectrum following the addition of 3σ of H2S. Panel b: residuals of each of the gas contributions compared with the observed spectrum with the greatest S/N, where the shaded grey region represents the estimated noise level.
Current usage metrics show cumulative count of Article Views (full-text article views including HTML views, PDF and ePub downloads, according to the available data) and Abstracts Views on Vision4Press platform.
Data correspond to usage on the plateform after 2015. The current usage metrics is available 48-96 hours after online publication and is updated daily on week days.
Initial download of the metrics may take a while.