Fig. 6
Download original image
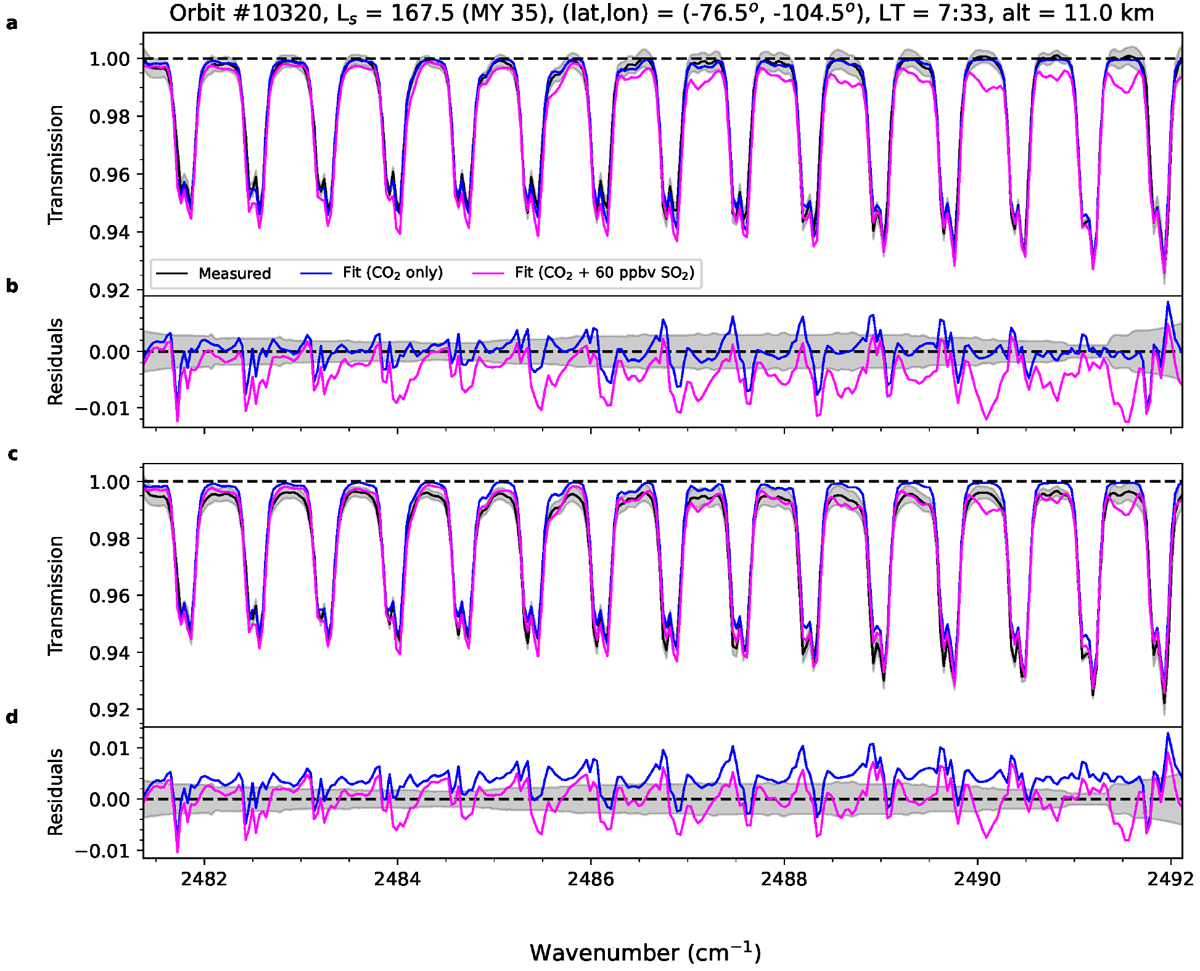
Example fit to a position 9 spectrum for which the lowest upper limits were retrieved from the entire position 9 dataset. In blue is shown the fit to the measured spectrum taking only CO2 absorption and instrumental parameters into account, with the synthetic spectrum showing the additional contribution of 60 ppbv of SO2, corresponding to the perceived 3σ level, superimposed in magenta. Estimated spectral uncertainty is shaded in grey. All spectra are normalised to the retrieved transmission baseline at unity for clarity. Panels a and b: spectral fit when the transmission baseline is retrieved only for the initial fitting of the CO2 lines with zero SO2 abundance. Panels c and d: spectral fit when the transmission baseline is re-retrieved following the addition of 60 ppbv of SO2 into the forward model.
Current usage metrics show cumulative count of Article Views (full-text article views including HTML views, PDF and ePub downloads, according to the available data) and Abstracts Views on Vision4Press platform.
Data correspond to usage on the plateform after 2015. The current usage metrics is available 48-96 hours after online publication and is updated daily on week days.
Initial download of the metrics may take a while.