Fig. 5
Download original image
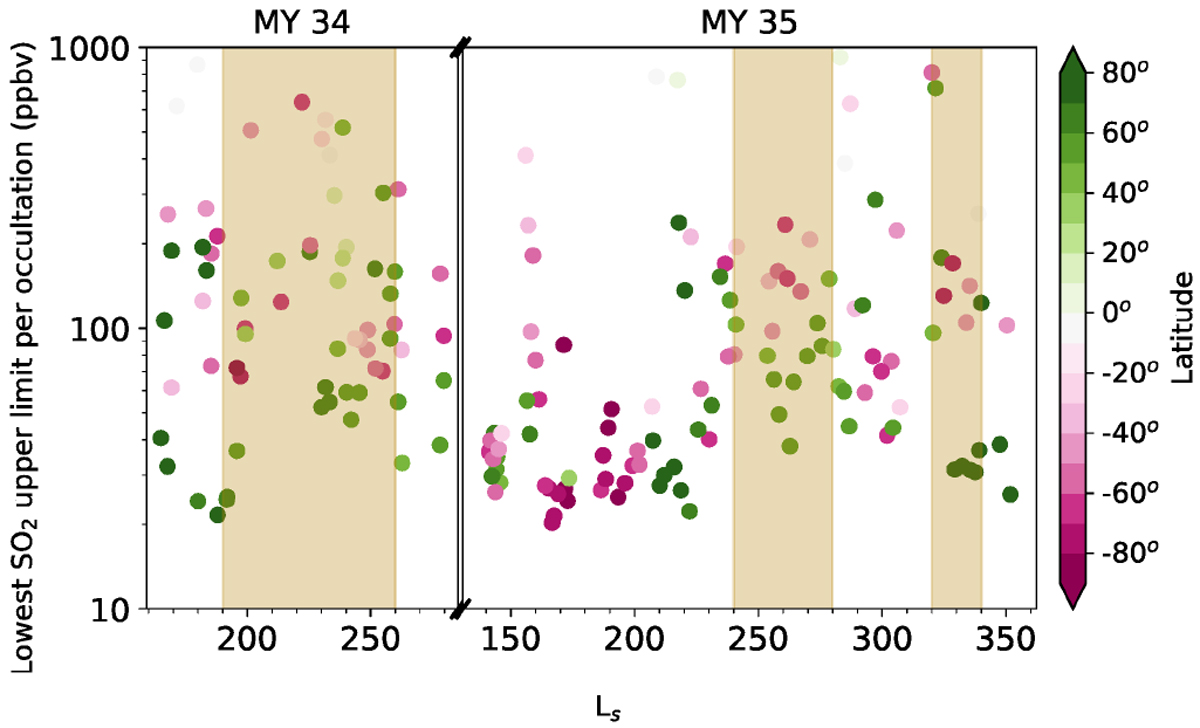
Change in the distribution of the lowest SO2 upper limit values derived from each ACS occultation sequence as a function of season, with the colour of each circle representingthe approximate latitude value where the measurement was obtained. Brown shaded regions indicate major dust storm events (Montabone et al. 2020; Olsen et al. 2021c).
Current usage metrics show cumulative count of Article Views (full-text article views including HTML views, PDF and ePub downloads, according to the available data) and Abstracts Views on Vision4Press platform.
Data correspond to usage on the plateform after 2015. The current usage metrics is available 48-96 hours after online publication and is updated daily on week days.
Initial download of the metrics may take a while.