Fig. 3
Download original image
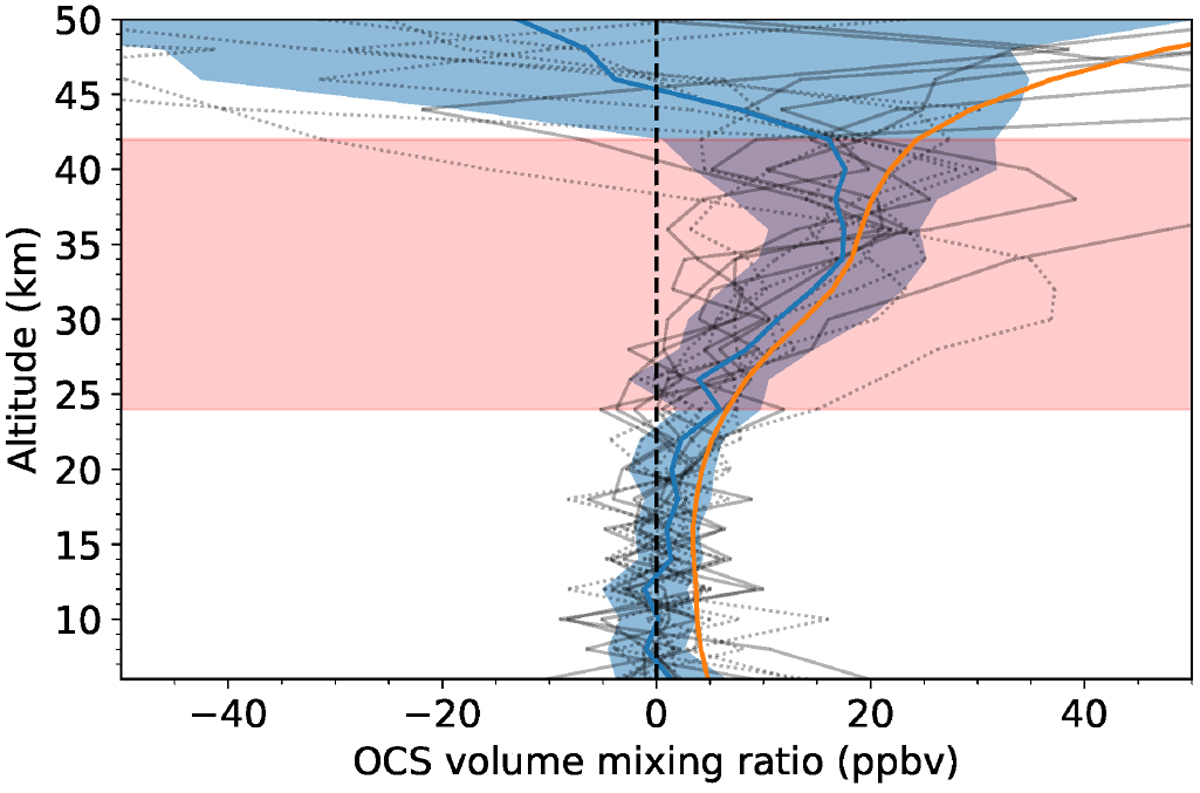
Illustrative example of the upper limit derivation methodology for OCS and H2S. Grey lines indicate the individual 2N vertical profiles of OCS retrieved according to (solid) step 3 and (dotted) step 4, for each row on the detector array. The solid blue line shows the weighted mean abundance profile,
![]() , derived fromthe individual retrievals, with the standard deviation,
, derived fromthe individual retrievals, with the standard deviation, ![]() , shown in the shaded blue region. The solid orange line shows the profile of
, shown in the shaded blue region. The solid orange line shows the profile of
![]() smoothed over altitude. The red shaded region shows the altitude range for which a 1σ detection was determined, i.e. where the value of
smoothed over altitude. The red shaded region shows the altitude range for which a 1σ detection was determined, i.e. where the value of ![]() is lower thanthe value of
is lower thanthe value of ![]() .
.
Current usage metrics show cumulative count of Article Views (full-text article views including HTML views, PDF and ePub downloads, according to the available data) and Abstracts Views on Vision4Press platform.
Data correspond to usage on the plateform after 2015. The current usage metrics is available 48-96 hours after online publication and is updated daily on week days.
Initial download of the metrics may take a while.