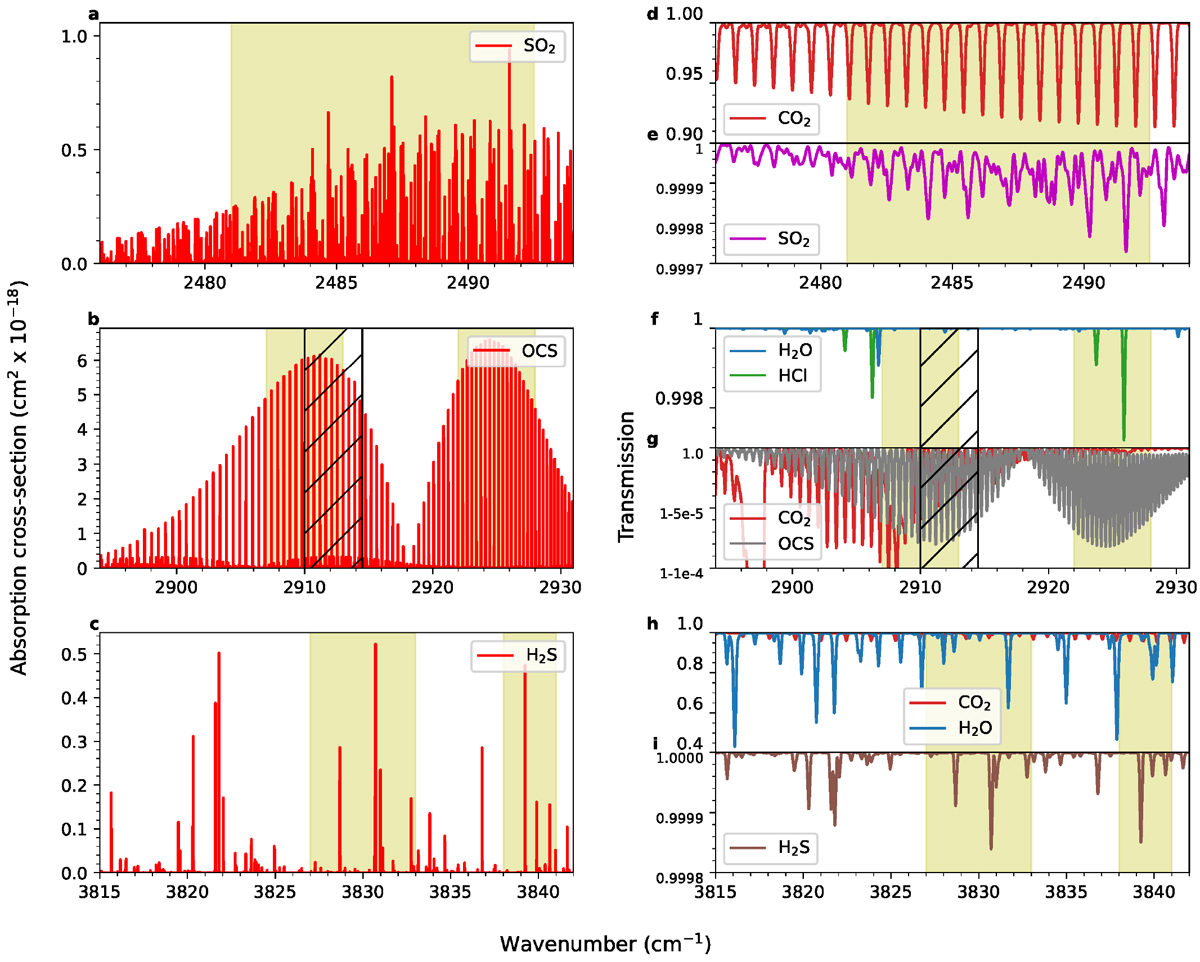
Fig. 2
Download original image
Computed cross-section values and simulated transmission spectra, for illustrative reference pressure and temperature values of 1 mbar and 200 K, respectively. Displayed wavenumber ranges reflect the coverage of the analysed diffraction orders, with the light yellow highlighted regions showing the spectral intervals over which detection limit retrievals were conducted, maximising absorption from the trace species in question while minimising overlapping absorptions from other known species. Panels a–c: Cross-section values for (a) SO2 in diffraction order 148, (b) OCS in diffraction orders 173 and 174, and (c) H2S in diffraction order 228. The grey cross-hatched regions in panels (b), (f), and (g) show the wavenumber range overlap between diffraction order 173 on the left and diffraction order 174 on the right. Panels d–i: Estimated transmission spectra given the aforementioned pressure and temperature conditions, convolved with a Gaussian instrument function of resolution R ~ 20 000. For each diffraction order, we plot the contributions of the trace species to the total transmission separately from the other interfering species, for which the contribution is several orders of magnitude larger.
Current usage metrics show cumulative count of Article Views (full-text article views including HTML views, PDF and ePub downloads, according to the available data) and Abstracts Views on Vision4Press platform.
Data correspond to usage on the plateform after 2015. The current usage metrics is available 48-96 hours after online publication and is updated daily on week days.
Initial download of the metrics may take a while.