Fig. 1
Download original image
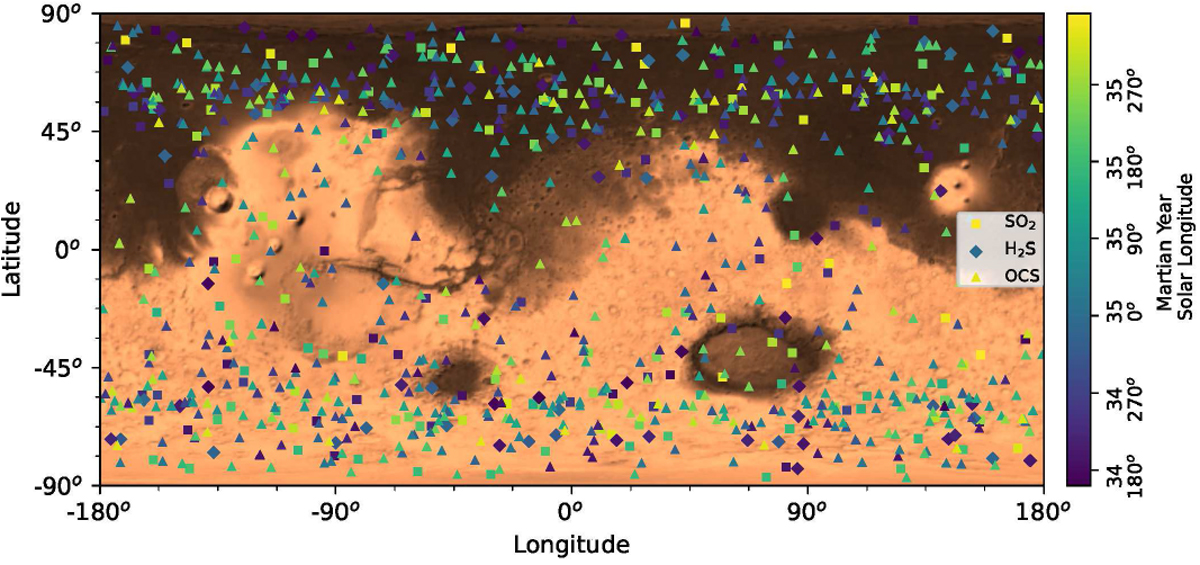
Spatial and temporal distribution of all the ACS MIR observations covered in this analysis. Squares represent observations made by ACS using grating position 9 (sensitive to SO2), diamonds using grating position 5 (H2S), and triangles using grating position 11 (OCS). The colour of each symbol represents the time, in units of solar longitude (Ls) over Martian years (MY) 34 and 35, at which the observation was obtained. The relative concentration of observations made closer to the poles is due to the TGO orbital geometry. Latitude values are planetocentric. The background image of Mars is based on topography data from the Mars Orbiter Laser Altimeter (MOLA) instrument on board Mars Global Surveyor (Smith et al. 2001).
Current usage metrics show cumulative count of Article Views (full-text article views including HTML views, PDF and ePub downloads, according to the available data) and Abstracts Views on Vision4Press platform.
Data correspond to usage on the plateform after 2015. The current usage metrics is available 48-96 hours after online publication and is updated daily on week days.
Initial download of the metrics may take a while.