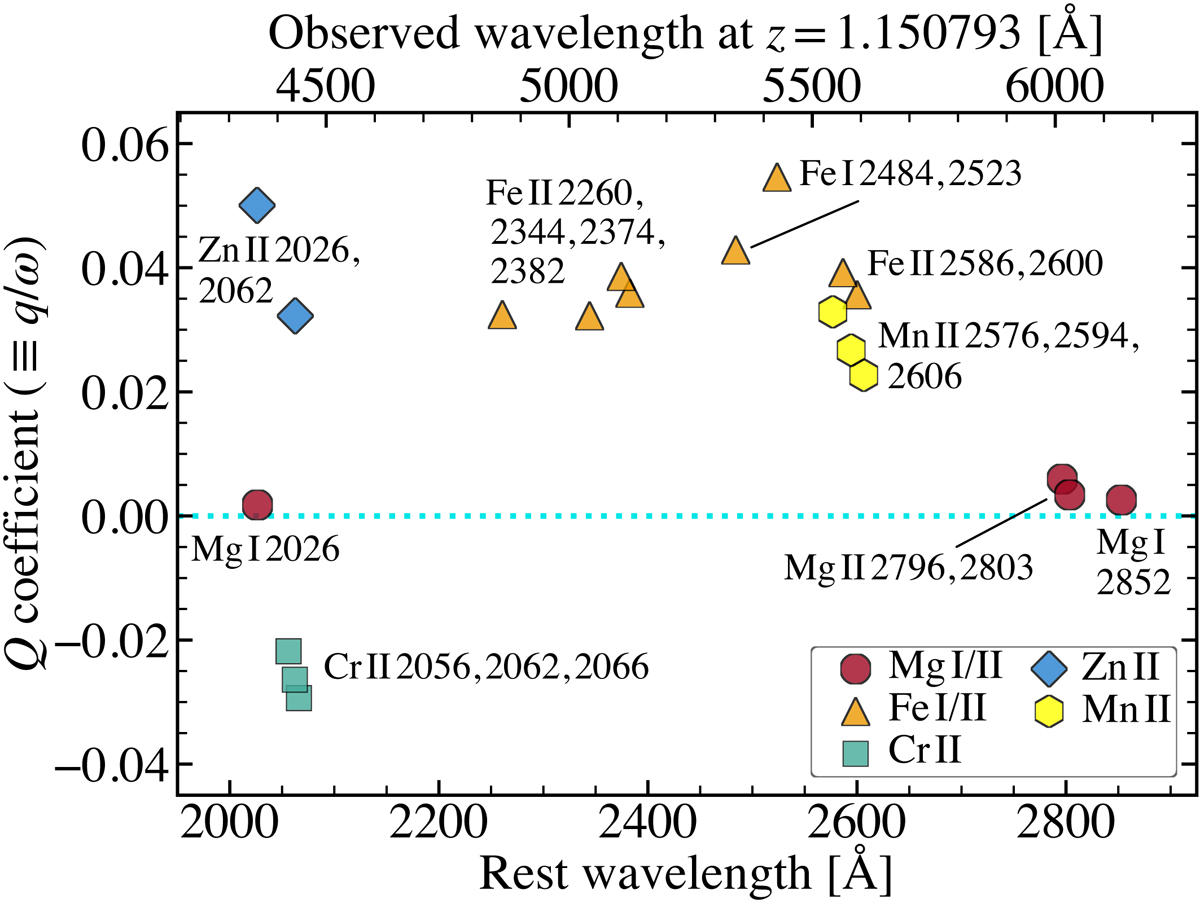
Fig. 3.
Download original image
Sensitivity (Q) coefficients for the transitions used here to constrain Δα/α in the zabs = 1.1508 absorber towards HE 0515−4414. The Q coefficients were compiled in Murphy & Berengut (2014) and are defined in Eq. (1). The lower horizontal axis shows the laboratory rest wavelengths of the transitions, while the upper axis shows the observed wavelength at zabs.
Current usage metrics show cumulative count of Article Views (full-text article views including HTML views, PDF and ePub downloads, according to the available data) and Abstracts Views on Vision4Press platform.
Data correspond to usage on the plateform after 2015. The current usage metrics is available 48-96 hours after online publication and is updated daily on week days.
Initial download of the metrics may take a while.