Fig. 2.
Download original image
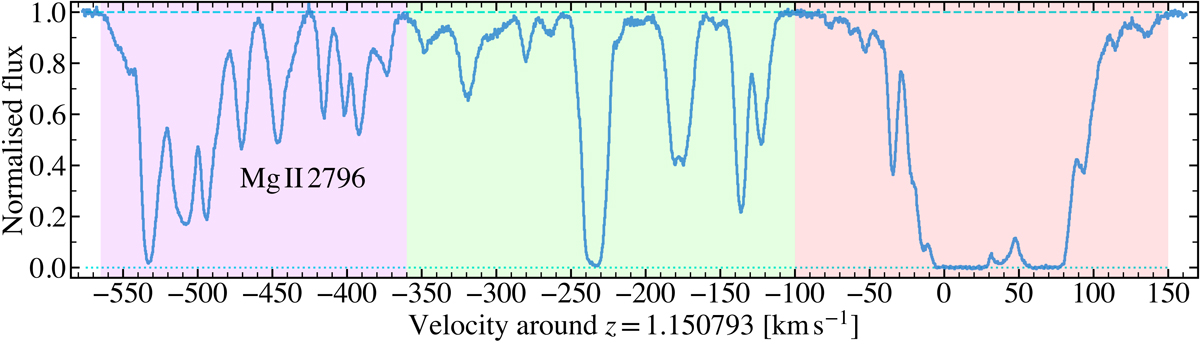
Definition of ‘regions’ in the zabs = 1.1508 absorber: left (purple shading; −565 to −360 km s−1), central (green; −360 to −100 km s−1) and right (red; −100 to 150 km s−1). The continuum-normalised flux in the strongest transition detected (Mg II λ2796) is plotted to illustrate that the flux returns to the fitted quasar continuum level at the region edges. While not strictly necessary in the fitting process, this helps avoid edge effects in the model when it is convolved with a (Gaussian) model of the ESPRESSO instrumental profile.
Current usage metrics show cumulative count of Article Views (full-text article views including HTML views, PDF and ePub downloads, according to the available data) and Abstracts Views on Vision4Press platform.
Data correspond to usage on the plateform after 2015. The current usage metrics is available 48-96 hours after online publication and is updated daily on week days.
Initial download of the metrics may take a while.