Fig. 9
Download original image
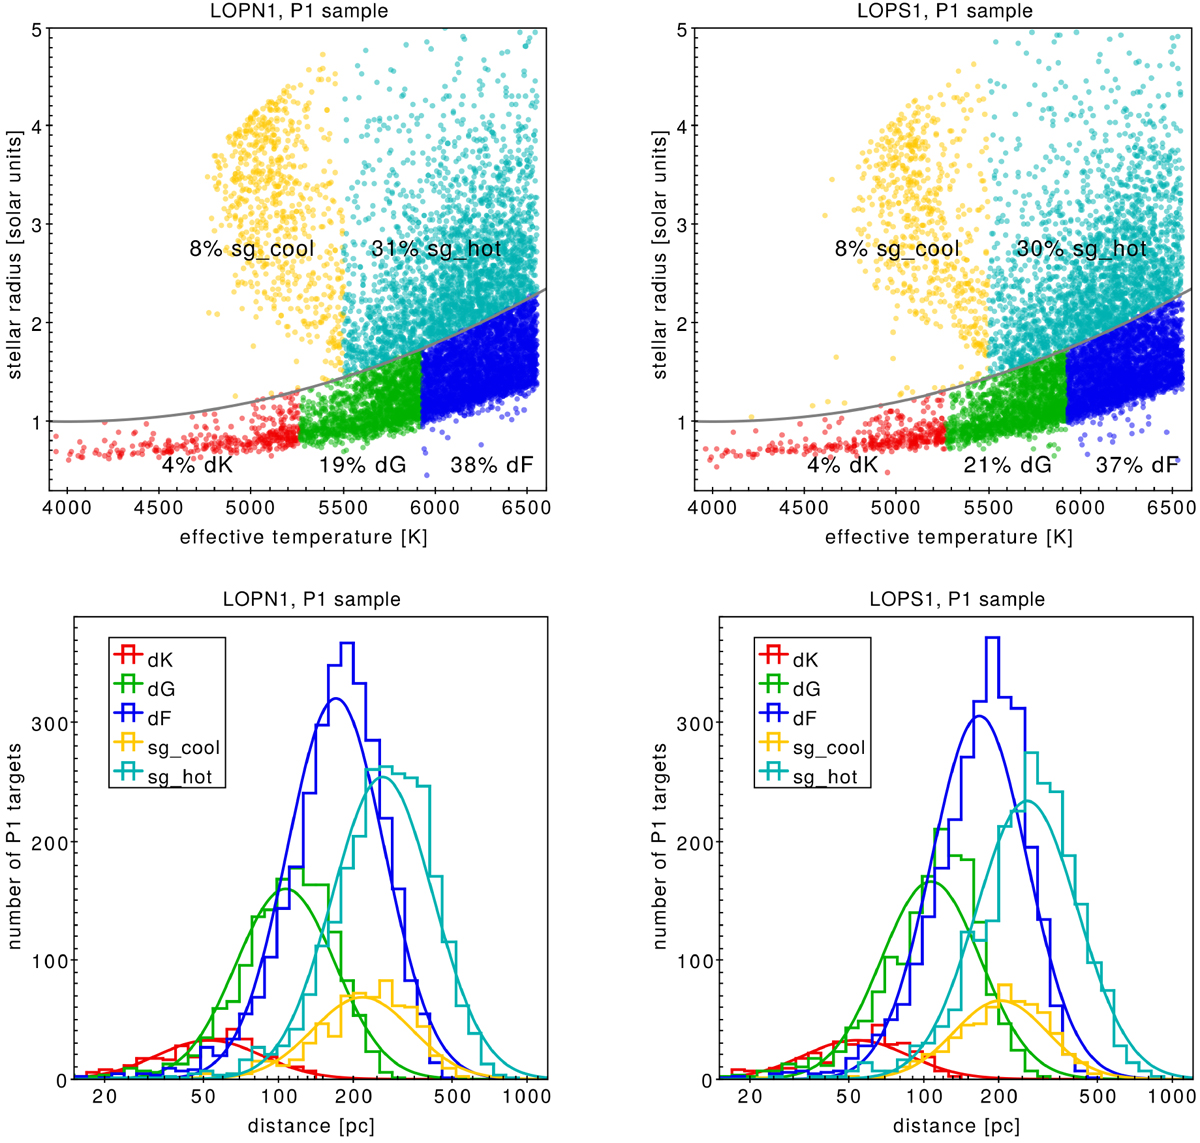
Astrophysical parameters of the P1 targets within the LOPN1 (left panels) and LOPS1 (right panels) provisional fields. Top panels: Distribution of P1 targets on the (Teff, R⋆) plane; stars are classified into five distinct groups representing main-sequence K-type dwarfs (dK), G dwarfs (dG), F dwarfs (dF), subgiants at Teff < 5500 K (sg_cool), and Teff > 5500 K (sg_hot). The labels show their relative occurrence. The gray line in both panels marks an arbitrary boundary between main-sequence and evolved stars (see text). Bottom panels: Histograms of the distribution in distance of the same subgroups. The best-fit lognormal distribution is also over-plotted with a continuous line.
Current usage metrics show cumulative count of Article Views (full-text article views including HTML views, PDF and ePub downloads, according to the available data) and Abstracts Views on Vision4Press platform.
Data correspond to usage on the plateform after 2015. The current usage metrics is available 48-96 hours after online publication and is updated daily on week days.
Initial download of the metrics may take a while.