Fig. 3
Download original image
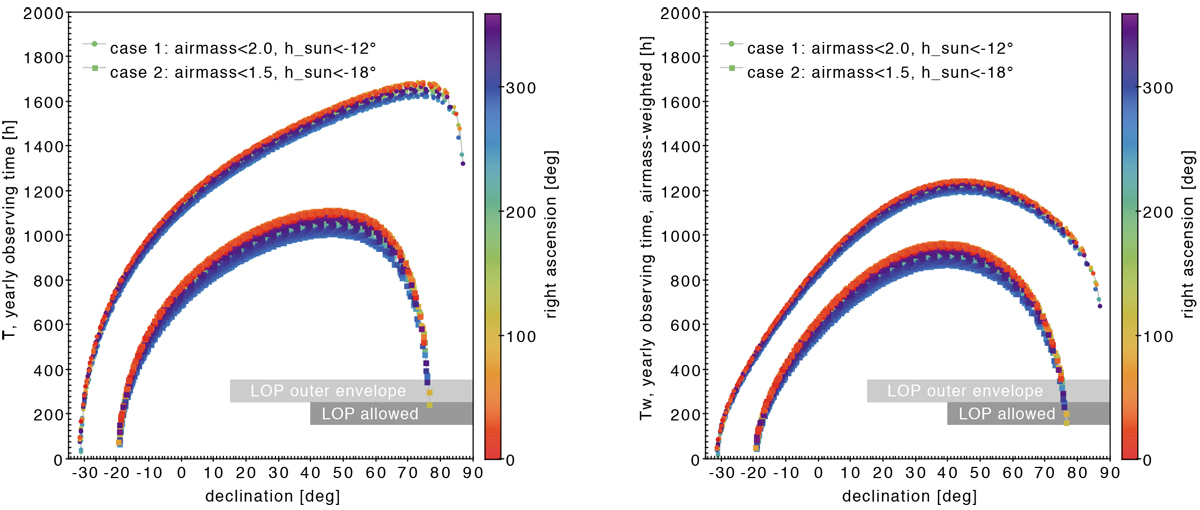
Left panel: integrated yearly observing time T in hours of a given star from a hypothetical astronomical observatory at latitude φ = 28.5°, as a functionof its equatorial coordinates α (color scale) and δ (horizontal axis). The two curves refer to two different sets of thresholds imposed on the maximum airmass X and the maximum solar elevation h⊙, as in legend. The declination range spanned by the |β| > 38° “outer envelope” and |β| > 63° “allowed region” (see Fig. 2) for the LOPN field is highlighted with gray boxes. Choosing an observatory with the same |φ| but in the southern hemisphere would yield the same results but with the δ sign reversed. Right panel: same as above, but now the integrated time Tw is weighted by 1∕X, as a more effective follow-up metric.
Current usage metrics show cumulative count of Article Views (full-text article views including HTML views, PDF and ePub downloads, according to the available data) and Abstracts Views on Vision4Press platform.
Data correspond to usage on the plateform after 2015. The current usage metrics is available 48-96 hours after online publication and is updated daily on week days.
Initial download of the metrics may take a while.