Fig. 7.
Download original image
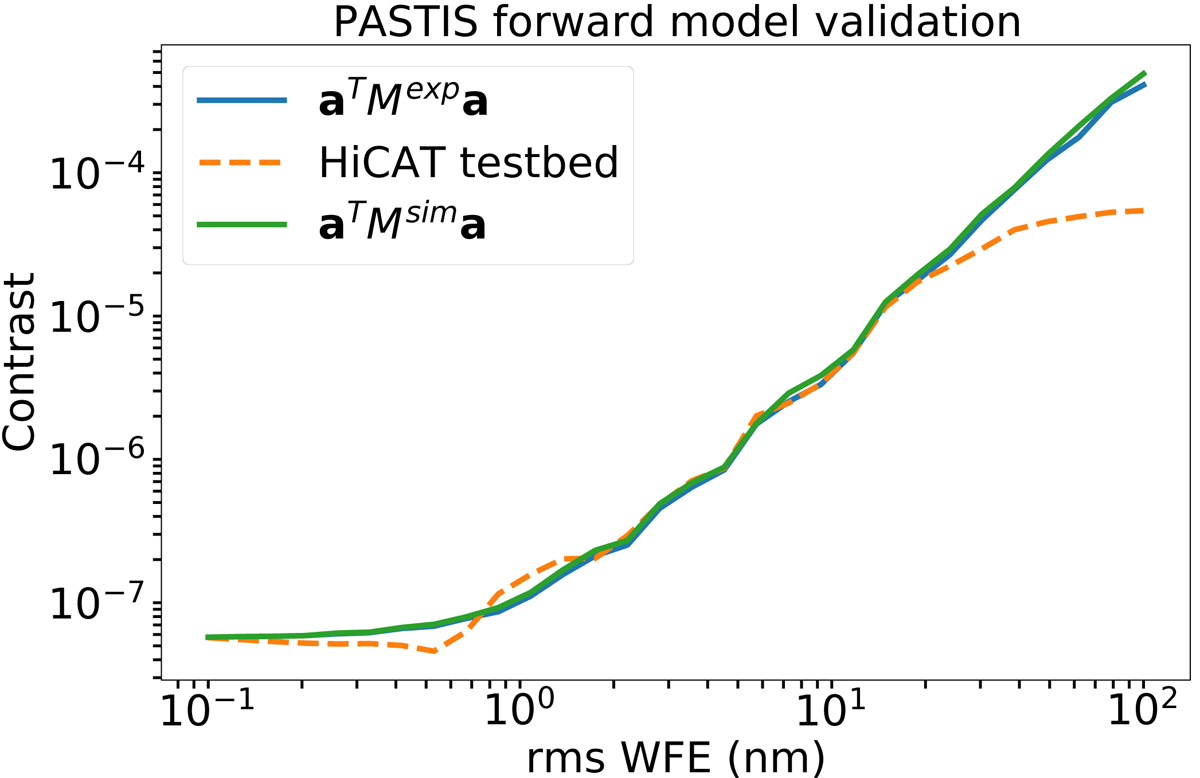
Validation of the deterministic forward model in Eq. (4) made by computing the contrast from the same segmented WFE maps with the experimental PASTIS matrix as in the middle panel of Fig. 6 (solid blue), with the simulated PASTIS matrix from the right panel of Fig. 6 (solid green), and with the HiCAT testbed (dashed orange). The curves flatten out to the left at the coronagraph floor, c0, and show linear behavior at increasing WFE, giving them their hockey-stick-like shape. The contrast calculation from the PASTIS equation with both matrices shows very good accordance with the testbed measurements; all three lines overlap at WFEs larger than 1 nm rms.
Current usage metrics show cumulative count of Article Views (full-text article views including HTML views, PDF and ePub downloads, according to the available data) and Abstracts Views on Vision4Press platform.
Data correspond to usage on the plateform after 2015. The current usage metrics is available 48-96 hours after online publication and is updated daily on week days.
Initial download of the metrics may take a while.